If you're a software engineer working with Kubernetes, you know how vital it is to have accurate, real-time information about your applications and resources. With StackState's dynamic Kubernetes observability dashboards, you can now access all the essential data you need for troubleshooting on a single screen. In this blog post, we'll discuss the key features of these dashboards, why they're valuable and how to get started with them.
What are StackState’s dynamic dashboards?
Dynamic Kubernetes observability dashboards bring together all crucial data into a single screen and organize it for easy consumption. StackState collects and correlates all data so engineers who need to troubleshoot issues can review necessary data in one place, without navigating through multiple tools. Key features of the dashboard include:
Most important metrics for each resource type. We’ve got you covered for services, pods, nodes, deployments, daemon sets, stateful sets, PVCs and persistent volumes.
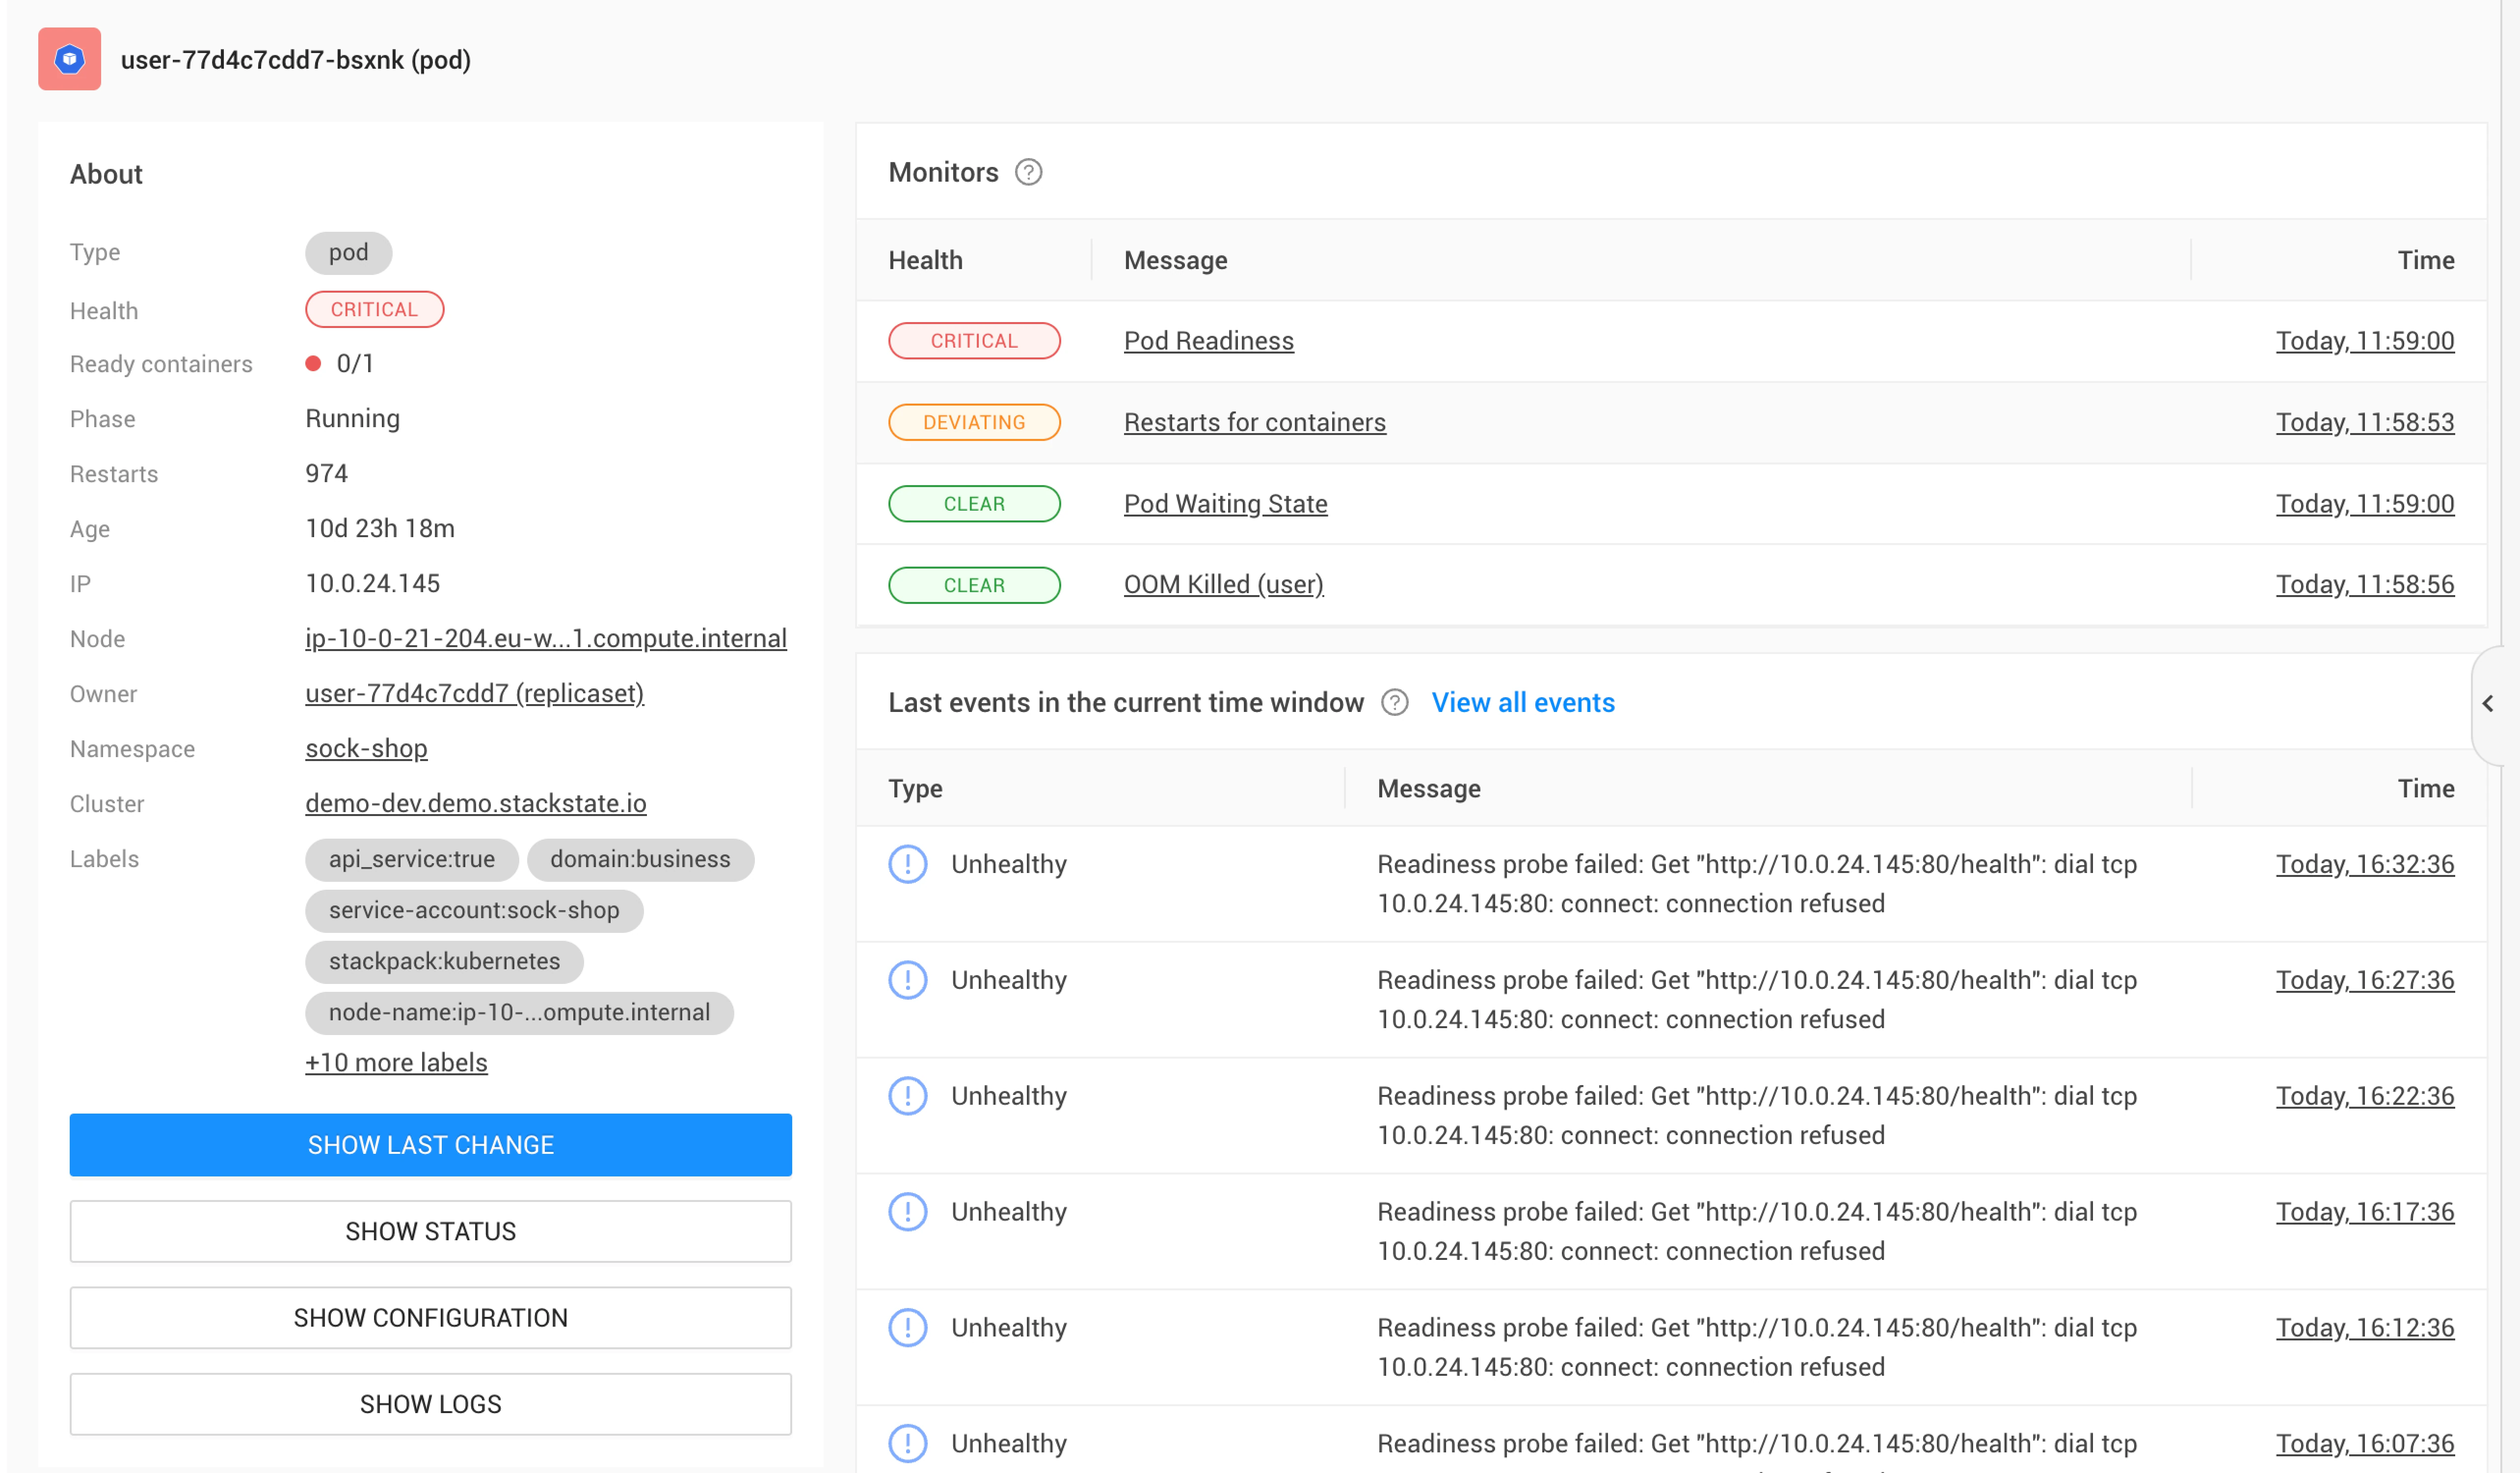
All relevant events
Status and configuration of each component
"Last Change" information – only a click away
Pod Highlights contain the container logs
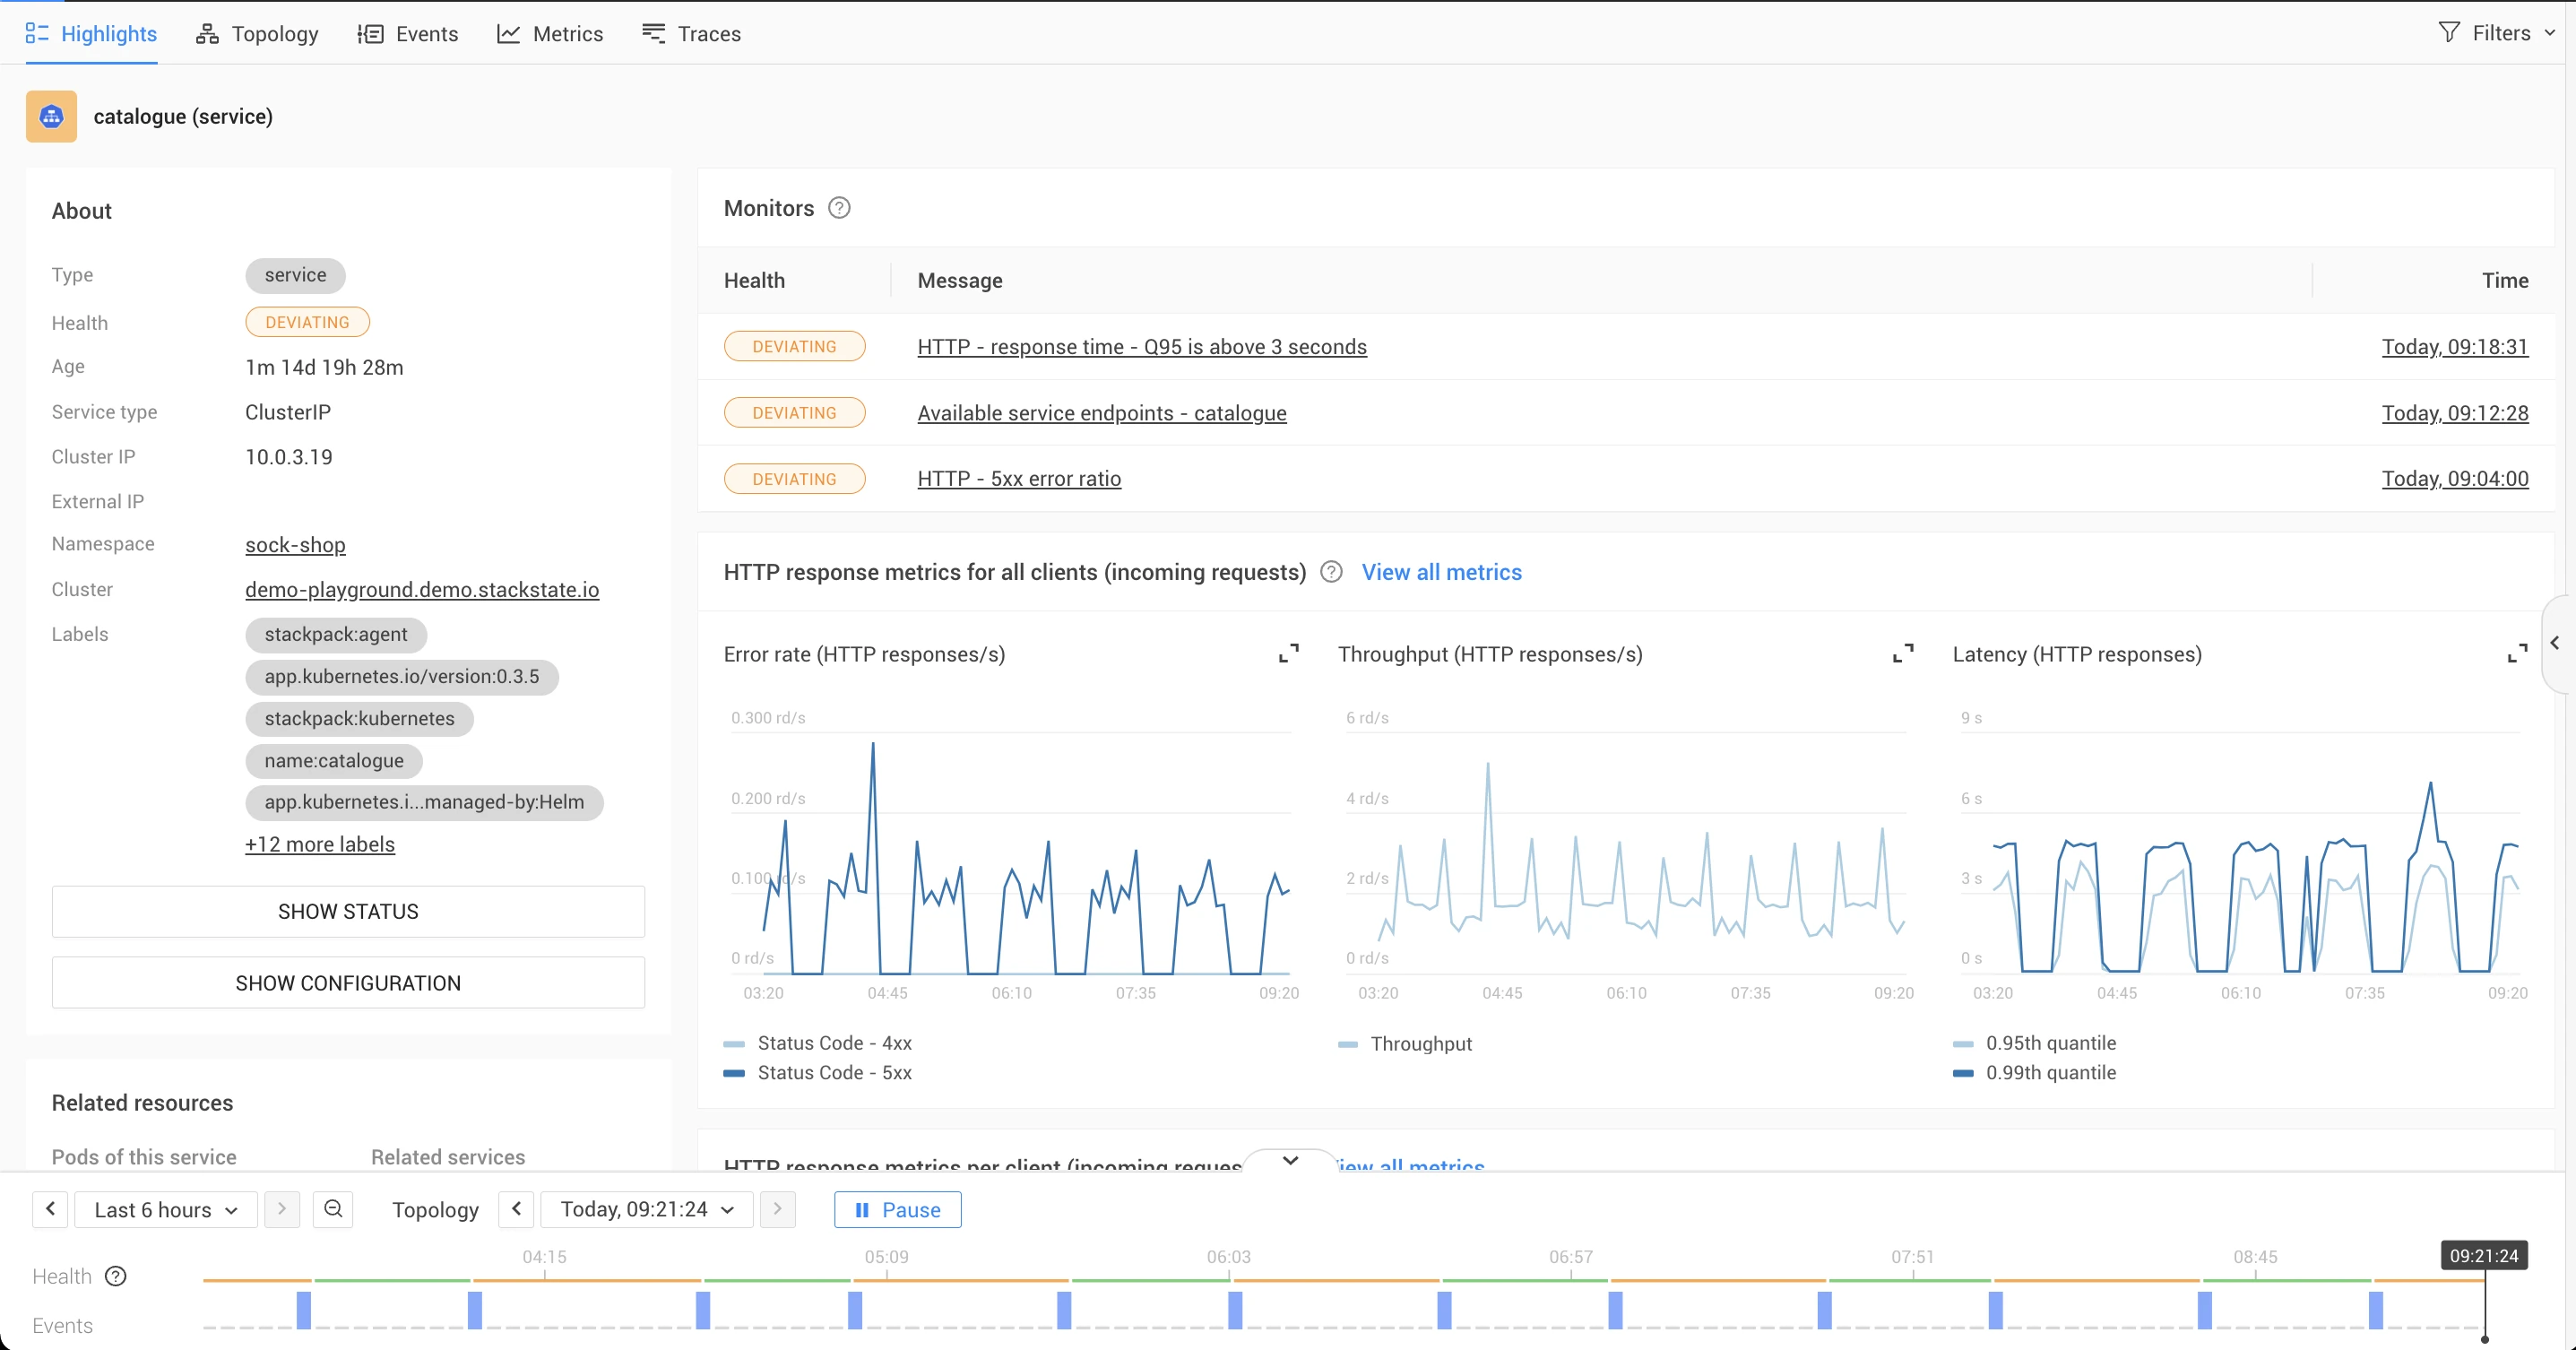
Service Highlights contain the golden signals (error rate, throughput and latency)
Important metadata such as labels, age, owner, namespace and cluster information
Health information for components and related resources
Why are they good?
Dynamic dashboards offer several benefits for engineers:
Pre-configured: No need to create every single dashboard – you get overview pages and detail pages for the most important resource types out of the box.
Time-oriented: The dynamic dashboards show you a dashboard for each resource, including its related resources at any moment in time. Information is automatically shown when a resource is active, but you can also go back to components that no longer exist in your cluster and see relevant information. This time-traveling feature is particularly powerful when you are doing post-mortems with your team.
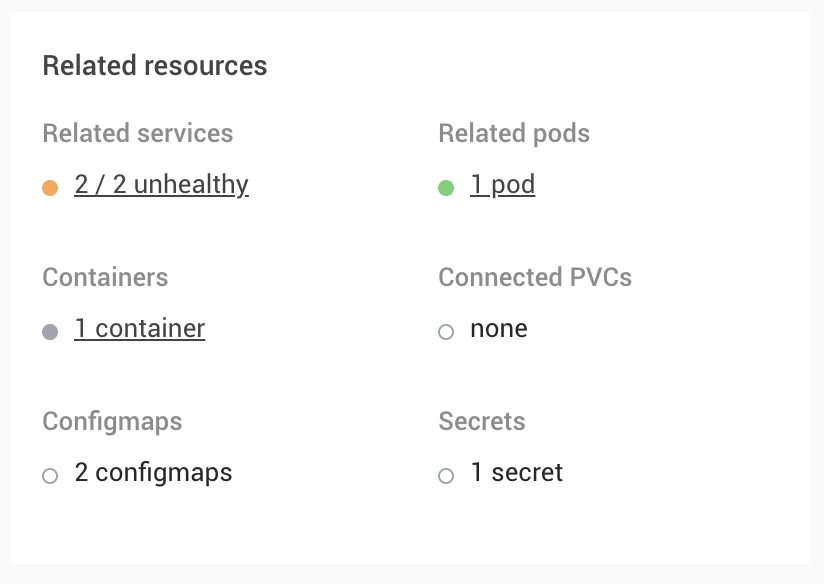
Interconnected: Dashboards are connected with each other through the "Related Resources" section, allowing easy navigation between resources.
Organized data: The displayed data is organized and prioritized for you, with focus placed on the most important metrics for troubleshooting. Additional metrics are just a single click away.
What do you need to do to get them?
StackState's dynamic dashboards are an integral part of our SaaS offering and are automatically provided with every level of the product. All overview and highlight pages are pre-configured and available as soon as data starts flowing into the system.
Who can benefit from dynamic dashboards?
Software engineering teams: Instead of your team creating dashboards in Grafana , StackState has them defined for you already. Teams benefit from having all core information in a single tool, resulting in clearer insights and reducing context switching between tools.
Platform engineering teams: Onboarding new teams becomes more manageable since there's no need to set up new dashboards for each team. Each team receives tailored dashboards showing only data from their components, no manual configuration required.
SRE teams: StackState makes it easier for development and applications teams to troubleshoot issues themselves, which reduces the burden on SRE teams. With all necessary data collected in dynamic dashboards, an engineer on call can usually solve an issue him or herself, without calling an SRE or other team member to provide troubleshooting expertise or knowledge about other services in the environment.
Under the hood
Here are few more details about StackState’s dynamic dashboards:
Data ingestion is done through StackState agents, which take only minutes to install and start sending data immediately.
StackState leverages VictoriaMetrics for scalable metrics storage, allowing the use of PromQL when you need to query for additional information.
You can extend insights with Grafana dashboards on top of StackState, eliminating the need for Prometheus. This combination is useful for visualizing core business metrics tailored to your needs.
Using dynamic topology, StackState tracks and stores the state of your clusters at any moment in time, over time, including all configuration and related resources. This rich data helps you pinpoint and troubleshoot any issue quickly and efficiently.
Try them yourself
Are you ready to experience the power of StackState's dynamic dashboards?
Try them out in our playground, featuring a Sock Shop demo application for you to explore and discover the benefits of streamlined Kubernetes troubleshooting. With StackState's dynamic dashboards, you'll enjoy faster, more efficient troubleshooting and spend less time navigating through multiple tools to get the data you need.