
Have you ever wondered how you can help Kubernetes manage your pods in the most efficient way? Kubernetes can do a decent job “out of the box,” but it can be optimized just like any other system. One such optimization in the Kubernetes world is introducing liveness probes, and in this post, you’ll learn everything about them.
What Is a Kubernetes Liveness Probe?
In order to understand what a liveness probe is in Kubernetes, we need a quick recap of what Kubernetes actually does. One of the main tasks of Kubernetes is to orchestrate your pods. This means that Kubernetes keeps track of running pods and compares them with the cluster's desired state. The desired state is defined by you, the user. You specify what kind of pods you want, how they should be run, and how many of them should be running. And by default, Kubernetes will do just that—read all the definitions you sent to it, save them as “desired state” to its own internal database, and ensure that the cluster matches that state.
For example, imagine that you create a simple NGINX deployment on your Kubernetes cluster. Kubernetes will then download the NGINX Docker image and instruct one of the nodes to run a container from that NGINX image. Once the container is up and running, the node will report back to the Kubernetes API server that it executed its order, and Kubernetes will be happy because then the cluster state matches your wish.
But here’s the catch. Think about what “container is up and running” actually means. A running container doesn’t necessarily mean a running application (inside that container). It could happen that the NGINX container is indeed running, but the web application that this NGINX server is supposed to serve failed to start correctly. Or maybe it started, but it’s not doing what it's supposed to do. Basically, Kubernetes can only assume that your application is running if its container is running, but it can’t be sure of it. As you can probably guess, this is a problem, because it can make your application unavailable.

And here comes the liveness probe to the rescue. A liveness probe solves that exact problem. Essentially, it tells Kubernetes how to validate that the application inside the container is actually running. Let’s go back to our NGINX example. A liveness probe, in this case, could say, “do an HTTP call to /health” here. Kubernetes will then use this method to assess if the pod is running, instead of a simple “is the container up and running” method. This is a very easy yet powerful mechanism to make your Kubernetes cluster run much more efficiently and with less downtime.
Before we dive into details of liveness probes, you need to know that in Kubernetes, there are also things called readiness probes and startup probes. Those two are often used together with liveness probes to bring maximal efficiency, but it’s the liveness probe that is usually configured first, and the other two are used in specific cases.
Types of Liveness Probes
In the NGINX example from the previous section, we mentioned that an HTTP call could be a liveness probe. And indeed, that’s one of the possibilities, but what if your application doesn’t have an HTTP server? This is why there are actually a few types of liveness probes.
Command Probe
This type of liveness probe executes a shell command to validate if the application is running. With this method, you can run any Linux command (as long as it’s available in your container). Typical usages of this type of probe include checking the existence or content of a specific file, executing your application's own binary (for example, with some “status” subcommand), or even executing some custom-made bash scripts.
HTTP, TCP and gRPC Probes
These are three different types of probes, but they all work similarly. They can be explained together as “network” probes. Unlike command probes, which can do everything and anything, network probes, as the name suggests, will validate that your application is running based on some network call. That call can be an HTTP, TCP or gRPC call. This is the most commonly used type of probe since, by design, microservices usually communicate with each other using REST APIs. Therefore, most of them do contain some HTTP servers anyway.
How to Add a Liveness Probe to Your Pod
Now that you know what a liveness probe is, it’s time to see them in action. Let’s start with a command probe.
To add a command liveness probe to a pod, you need to add a few lines of code to the containers section in your Kubernetes deployment definition:
livenessProbe:
    exec:
        command:
            - ls
            - /tmp/processing
        initialDelaySeconds: 10
        periodSeconds: 3
The first three lines inform Kubernetes that we want to configure a liveness probe, and that its type should be “command.” Then we provide the actual command to run, with each piece of command split into new lines. In the end, we have two more parameters. The first one defines how long Kubernetes should wait before starting to validate the liveness probe. This is useful for applications that take a while to initiate. For example, your application may need to load a lot of data on startup or wait for its dependencies. Therefore, to avoid situations where Kubernetes will kill your application before it actually gets started, the initialDelaySeconds parameter can be set to give your application some time to properly initiate. The last parameter, periodSeconds defines how often should Kubernetes run livenessProbe. The more often you run it, the quicker you’ll spot any issues, but at the same time, the more stress you’ll put on Kubernetes.
So, in the example above, our liveness probe will execute the ls /tmp/processing command inside the NGINX container to validate if our NGINX is running correctly. In this example, we assume that the application in that pod will create a file called processing in the /tmp directory whenever it’s doing whatever it’s supposed to be doing. So our liveness probe will check if that file exists. If that file suddenly disappeared, it’d be a good indication that our NGINX application finished processing one piece of work, but for some reason, it didn’t start processing the next part. Maybe it hung or maybe it faced some error. In any case, it should be restarted, and that’s exactly what Kubernetes will do once it won’t find the /tmp/processing file in that container.
How do you validate that your liveness probe is actually working, then? You can do that by describing your pod. In the output from the kubectl describe pod [pod_name] command, you’ll find the Liveness section, which will tell you what exact probe is being used, together with the number of successes and failures:
$ kubectl describe pod nginx-deployment-5f76b9df57-7jc6b
Name: nginx-deployment-5f76b9df57-7jc6b
(...)

Liveness: exec [ls /tmp/processing] delay=20s timeout=1s period=3s #success=1 #failure=0
In the output we can see one “success” and zero “failures” of our probe. This means that Kubernetes ran our probe which executes ls/tmp/processing and that command returned status code 0 (which is a standard way for any Linux command to report “success”).
If I’ll now go and manually delete the /tmp/processing file from the container, you should see the failure count going up as well as an entry in the Events section of the pod describe command output:
Events:
  Type     Reason     Age              From               Message
  ----     ------     ----             ----               -------
  Normal   Scheduled  4m22s            default-scheduler  Successfully          assigned default/nginx-deployment-5f76b9df57-7jc6b to mint-vbox
(...)


Warning  Unhealthy  1s (x2 over 4s) kubelet Liveness probe failed: ls: cannot access '/tmp/processing': No such file or directory
By default Kubernetes will restart your pod after 3 failures of the Liveness probe (which in our case would mean that command ls /tmp/processing returned a status code other than 0 three times). If you want to change the default behaviour and, for example, want your pods to be restarted after only 1 Liveness probe failure, you need to add failureThreshold: 1 to your Liveness probe configuration.
So, in our case, we should see that Kubernetes restarted the pod as a result of three consecutive liveness probe failures:
$ kubectl get pods
NAME                                READY   STATUS    RESTARTS      AGE
nginx-deployment-5f76b9df57-7jc6b 1/1 Running 1 (14s ago) 4m38sHTTP Probe
Let’s move to the HTTP probe now. But before I show you how to configure an HTTP liveness probe, let’s quickly see another example of what exact problem the liveness probe can solve. Imagine that you deploy your application based on an NGINX server, and this is what you see when you access the application:
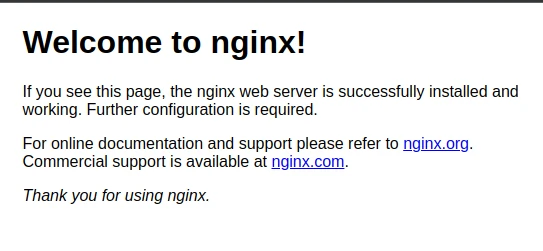
Do you see the problem already? NGINX is working perfectly fine. So from Kubernetes’s perspective, your pod is ”up and running.” But, while NGINX is indeed “up and running,” it doesn’t serve your application, but its own default “Welcome to nginx!” page. And that’s something you definitely don’t want to show to your users. This could indicate, for example, that there was an issue with loading your custom NGINX configuration.
It’s time to add an HTTP liveness probe to remedy that. Let’s say that your application should be accessible at the /myapplication endpoint. We can then simply instruct Kubernetes to validate if the /myapplication endpoint returns HTTP 200. We do it like this:
livenessProbe:
      httpGet:
        path: /myapplication
        port: 80
      initialDelaySeconds: 5
      periodSeconds: 3
And just like that, we moved from the not-useless-but-not-so-helpful “is nginx running” situation to the much more helpful “is my application” running situation. This type of liveness probe will help you avoid not only situations like our example, where your application fails to load correctly, but it’ll also help you make sure that your application is still running correctly hours, days, or weeks later.
Liveness Probe Best Practices
Liveness probes are relatively easy to understand and quite straightforward to use. But there are some do’s and don’ts too. Here are a few tips for you:
As much as it sounds like a great idea to check your application's dependencies in its liveness probe, it’s actually a bad practice. This is because Kubernetes may restart your totally healthy pod just because one of its dependencies failed. Imagine a microservice way downstream in the dependency graph that is causing restarts for everything that uses it - it can create an unnecessary avalanche of restarts. which may, of course, cause some issues for your pod. But iIn a case like this, your pod should just wait for the dependency issue to be resolved instead of signaling that it should be being restarted, since that won’t solve the problem. But don’t get me wrong. Of course you should be monitoring the dependencies of your application. I’m only saying that a liveness probe is not the best place to do it. Liveness probes should focus specifically and explicitly on the container inside that specific pod. Dependencies can be better checked using readiness probes or dedicated tools such as StackState.
I already mentioned this briefly before, but don’t forget to make good use of the initialDelaySeconds parameter. So many people think that the shorter the initial delay, the better, and therefore they set it too low. In practice, it really doesn’t hurt anything to increase the initial delay (of course, as long as we’re talking about a reasonable number, and you don’t set the initial delay to three hours). If your application takes, for example, eight seconds on average to start, don’t set your initial delay to eight or even nine seconds. Set it to something like 12 seconds. Those few extra seconds won’t cause any issues, but they will cover you for times when your application startup time increases randomly due to many possible reasons.
I also said earlier that an HTTP call to /health is a very common liveness probe. And while this can be perfectly fine, it can also be not so useful in some cases. We’ve seen many situations where the /health endpoint is just a hardcoded endpoint on your web server that always returns HTTP 200 as long as the web server is running. In such cases, you can still run into the same situation that a liveness probe is supposed to solve. Your application won’t be working properly, but your /health endpoint will still return HTTP 200. For this reason, you should either think about using your actual application endpoint (like we did with our example of calling /myapplication) or make sure that your /health endpoint has at least some logic behind it.

Summary
Liveness probes are relatively easy to implement, yet they’ll significantly improve the resiliency of your applications running in Kubernetes. We only covered the basic usage of liveness probes. There are more options and parameters you can use. For example, you can validate HTTP headers when using the HTTP liveness probe. But all these extras depend on specific use cases, so we leave you some room for exploring on your own. And if you ended up here because you care about your systems' reliability, feel free to look at StackState.
About StackState
Designed to help engineers of all skill levels who build and support Kubernetes-based applications, StackState provides the most effective solution available for Kubernetes troubleshooting. Our unique approach to full-stack observability helps teams quickly detect and remediate issues, so they can ensure optimal system performance and reliability for their customers. With StackState’s comprehensive observability data, the most complete dependency map available, out-of-the-box applied knowledge and step-by-step troubleshooting guidance, any engineer can remediate issues accurately and with less toil.
As a company dedicated to helping teams succeed with Kubernetes, we want to provide useful information in as many related areas as we can. We hope this tutorial proves helpful for your team. When it’s time to set your focus on Kubernetes troubleshooting, sign up for a free trial to see how simple it can be.