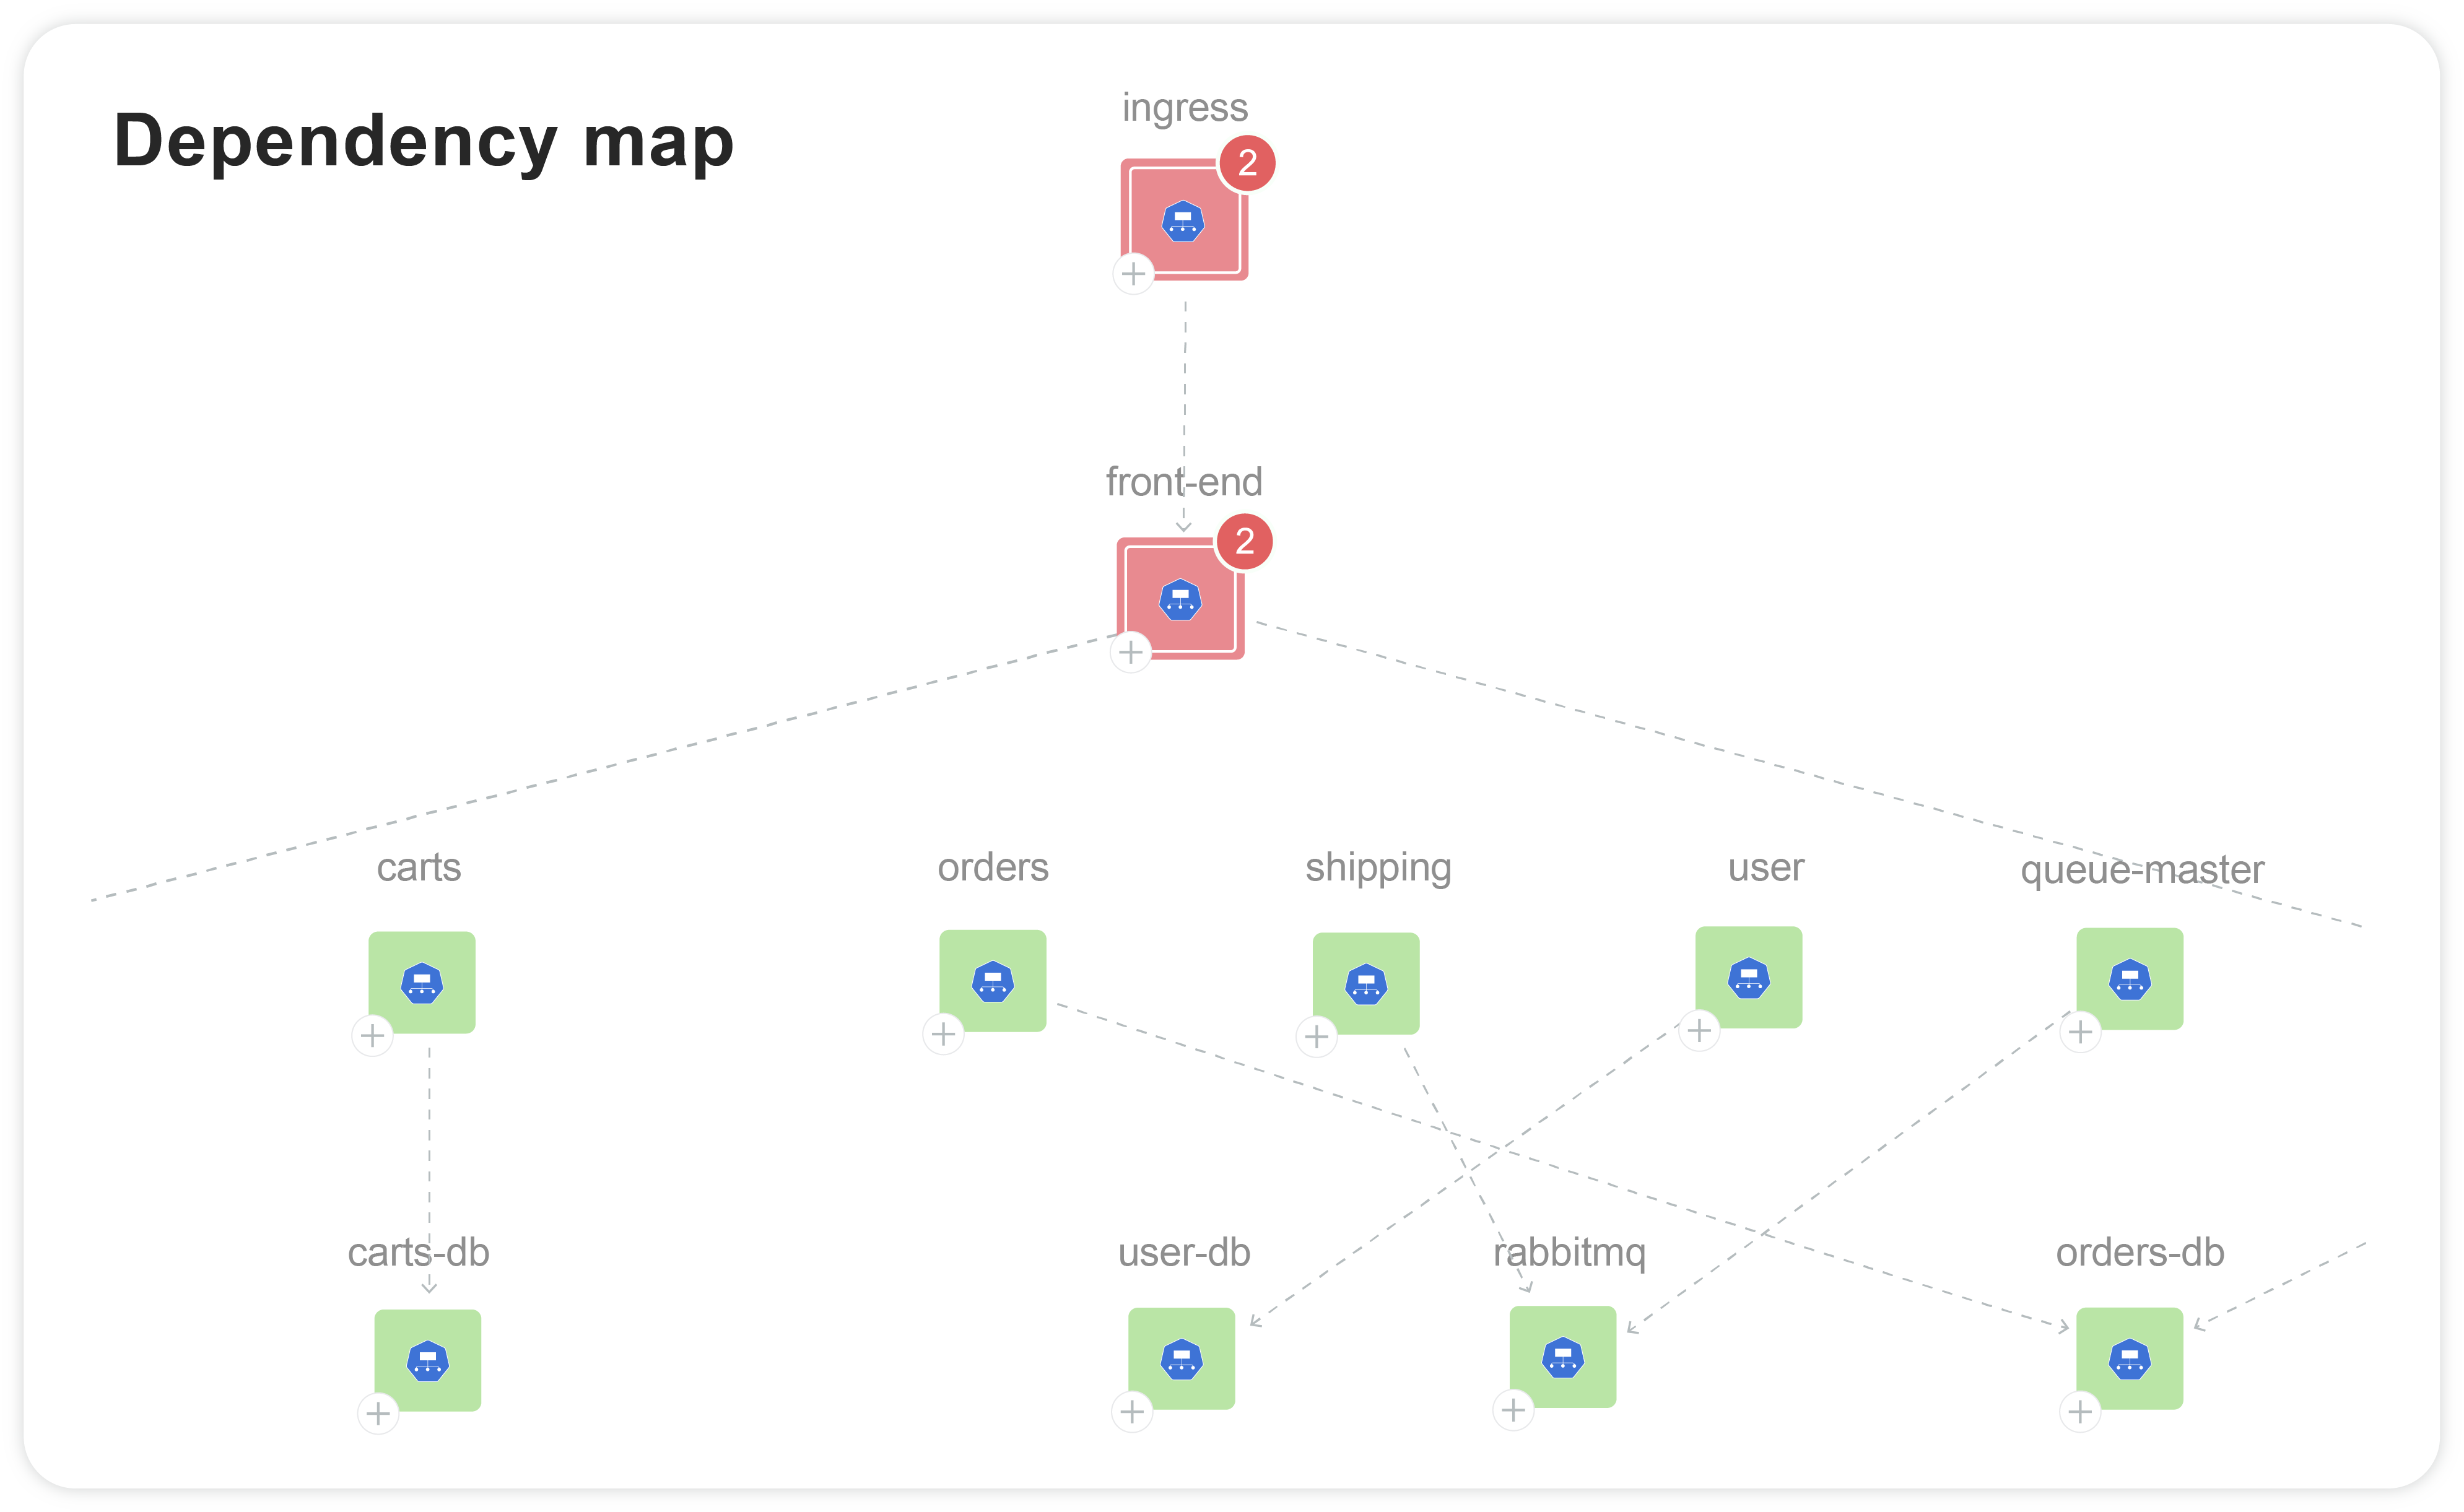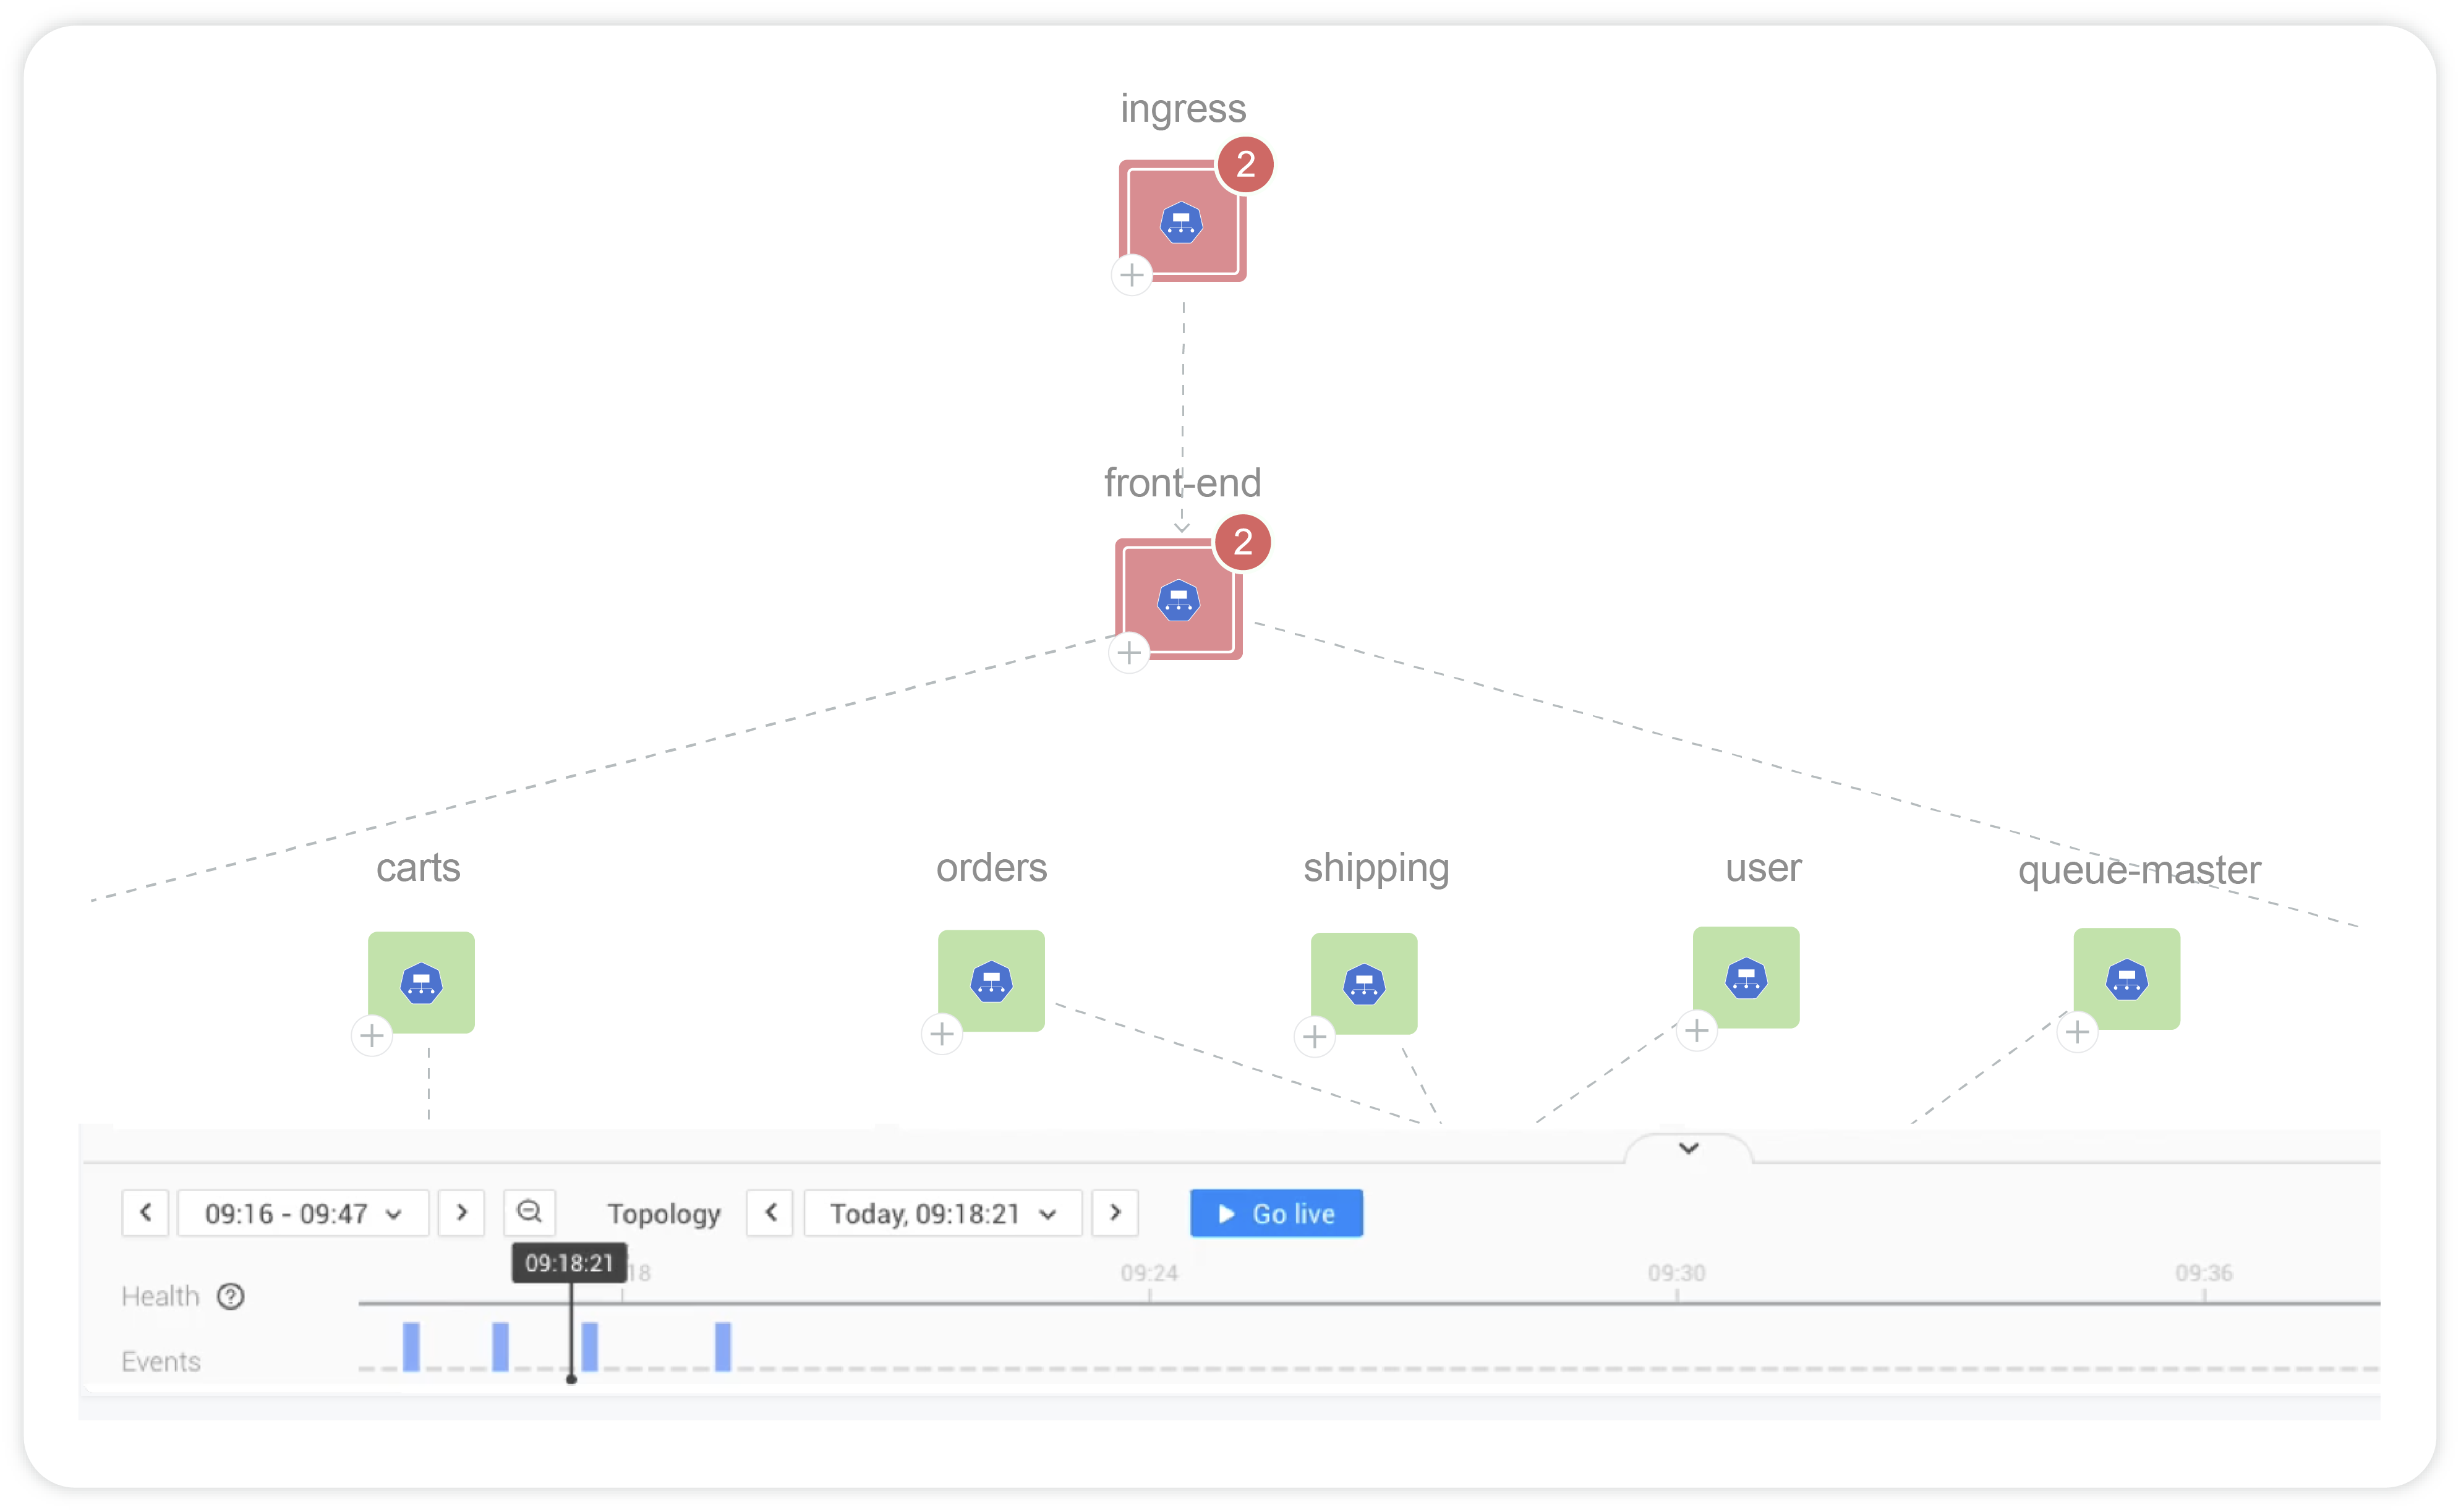


Provide a contextual and holistic view of your tech stack for complete infrastructure clarity
Centralize information for developers, platform engineers, and business leaders through a unified interface
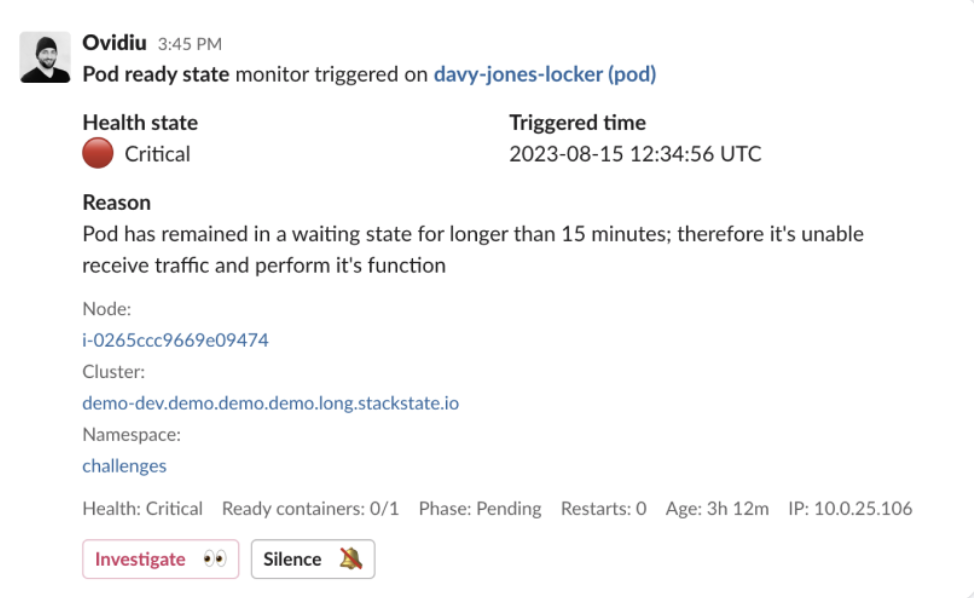
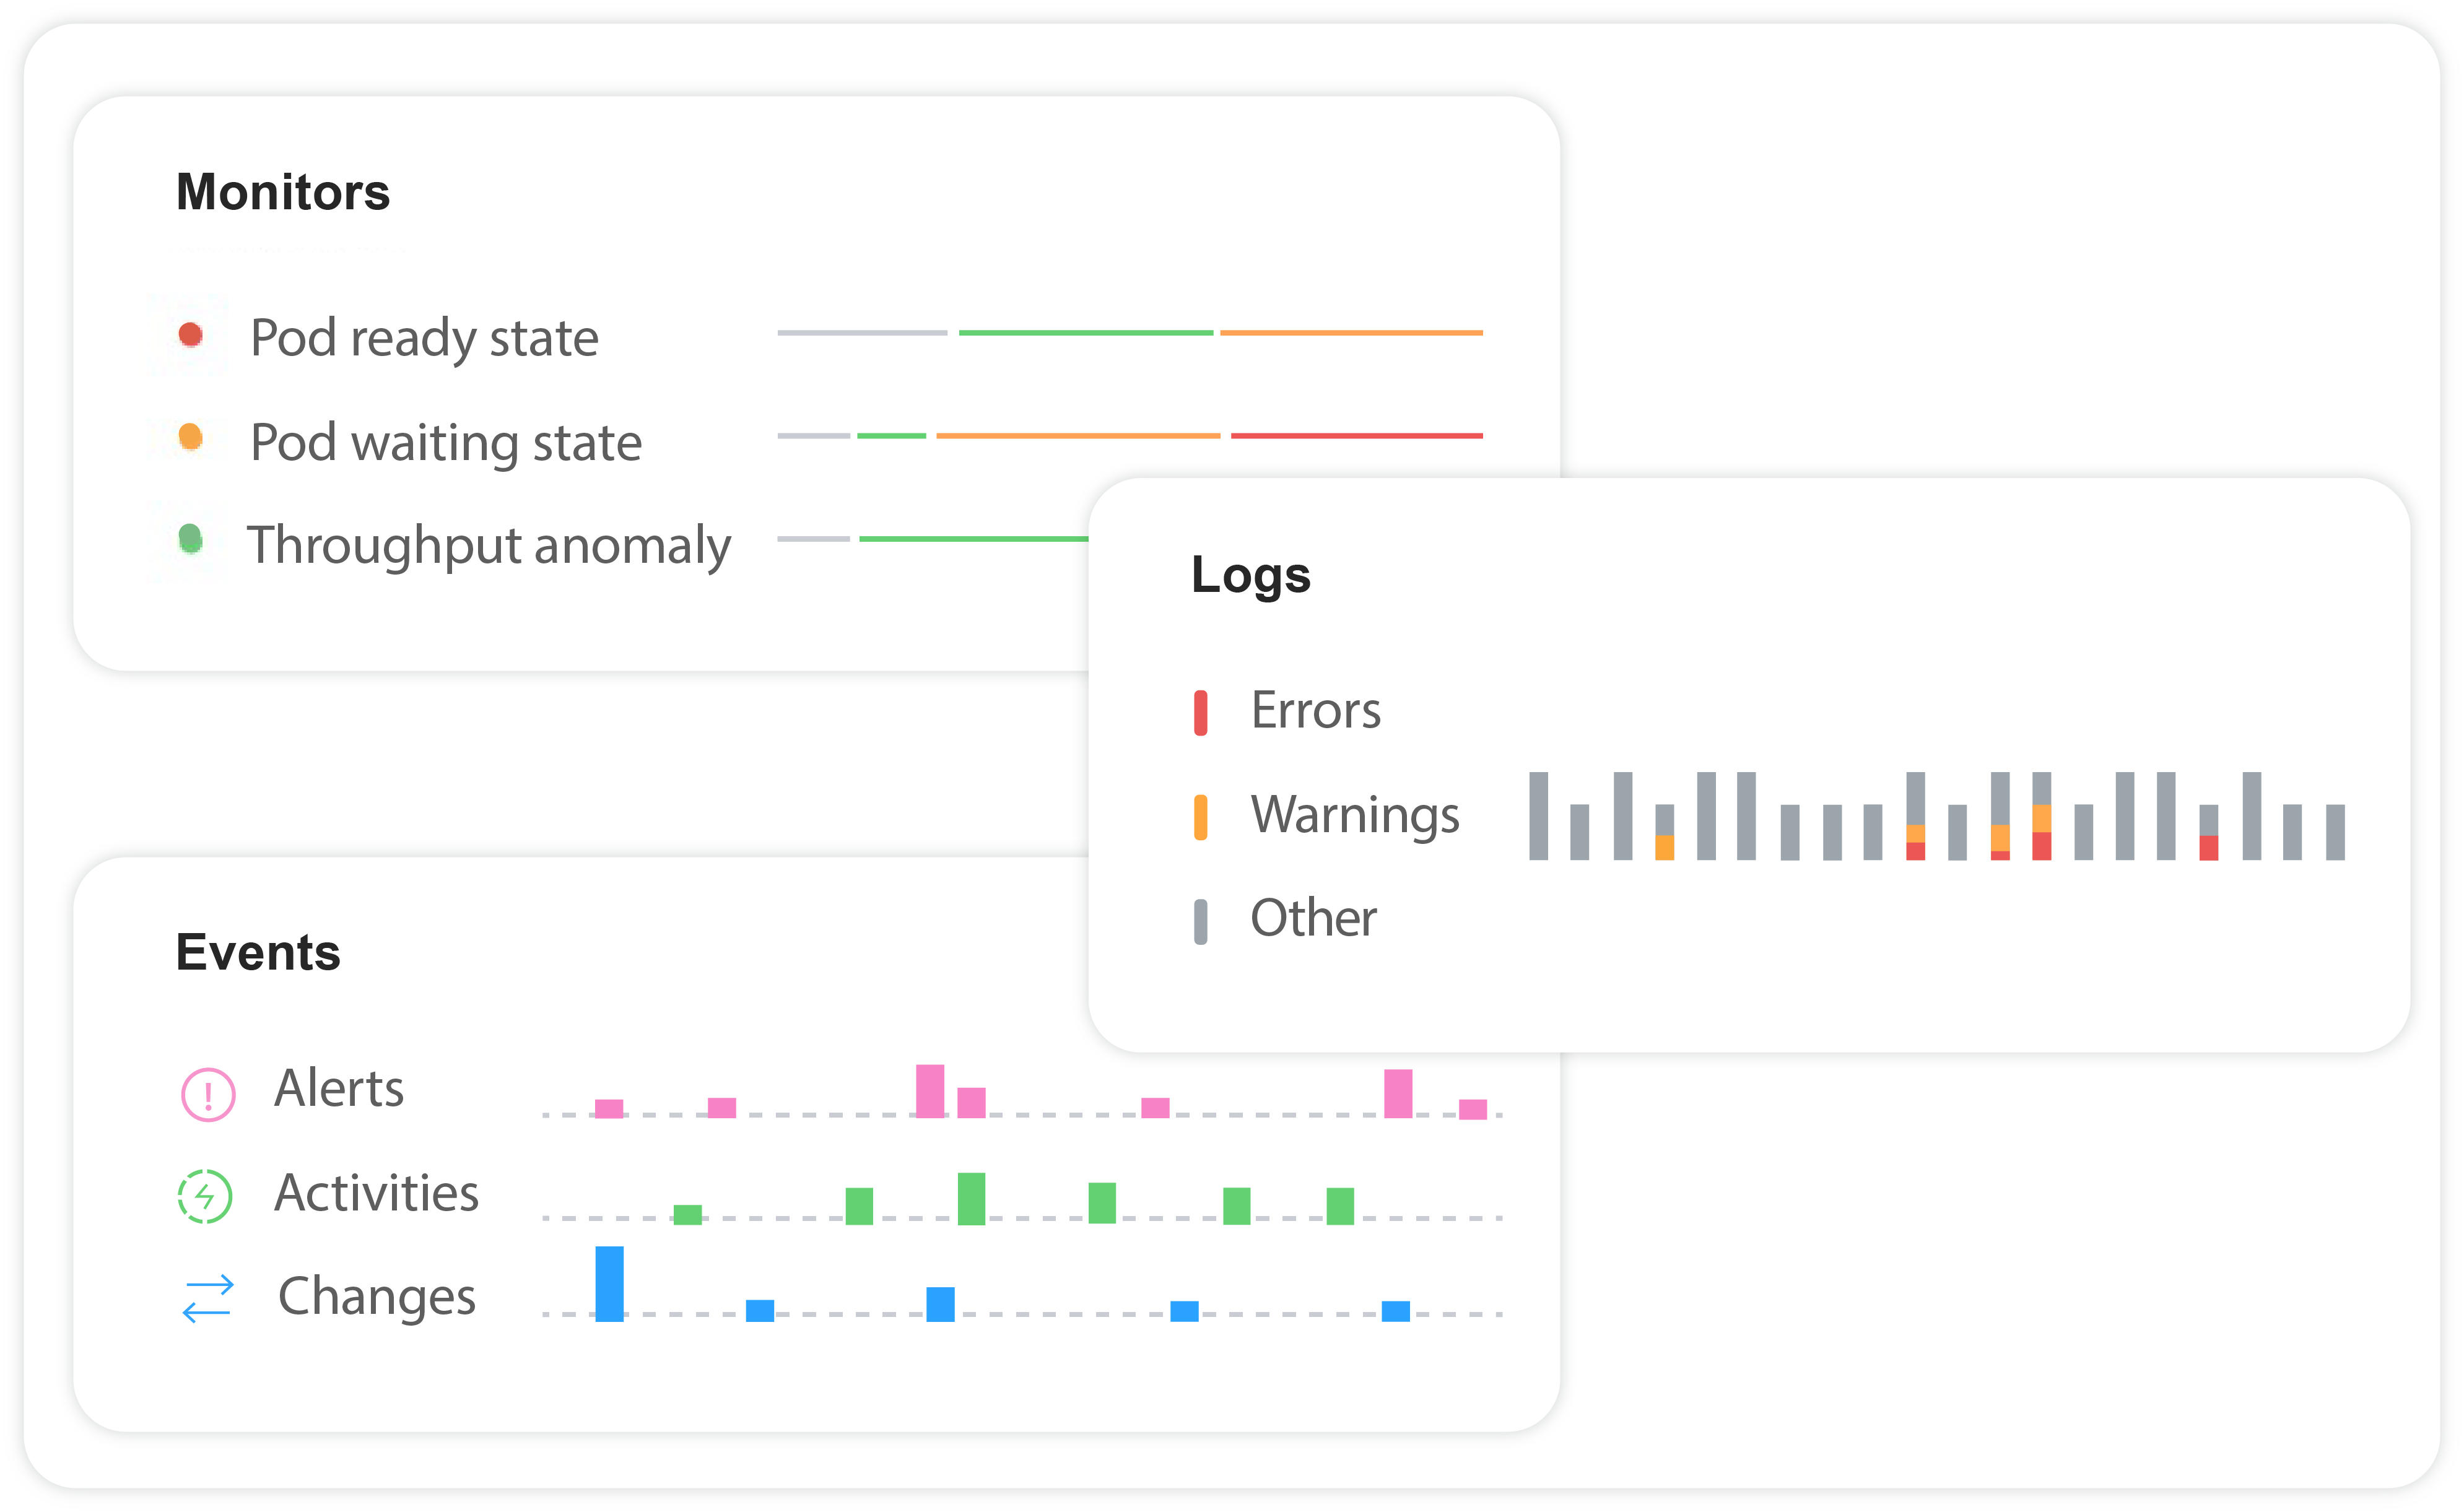
Reduce alert fatigue by correlating changes, detecting anomalies, and acting proactively
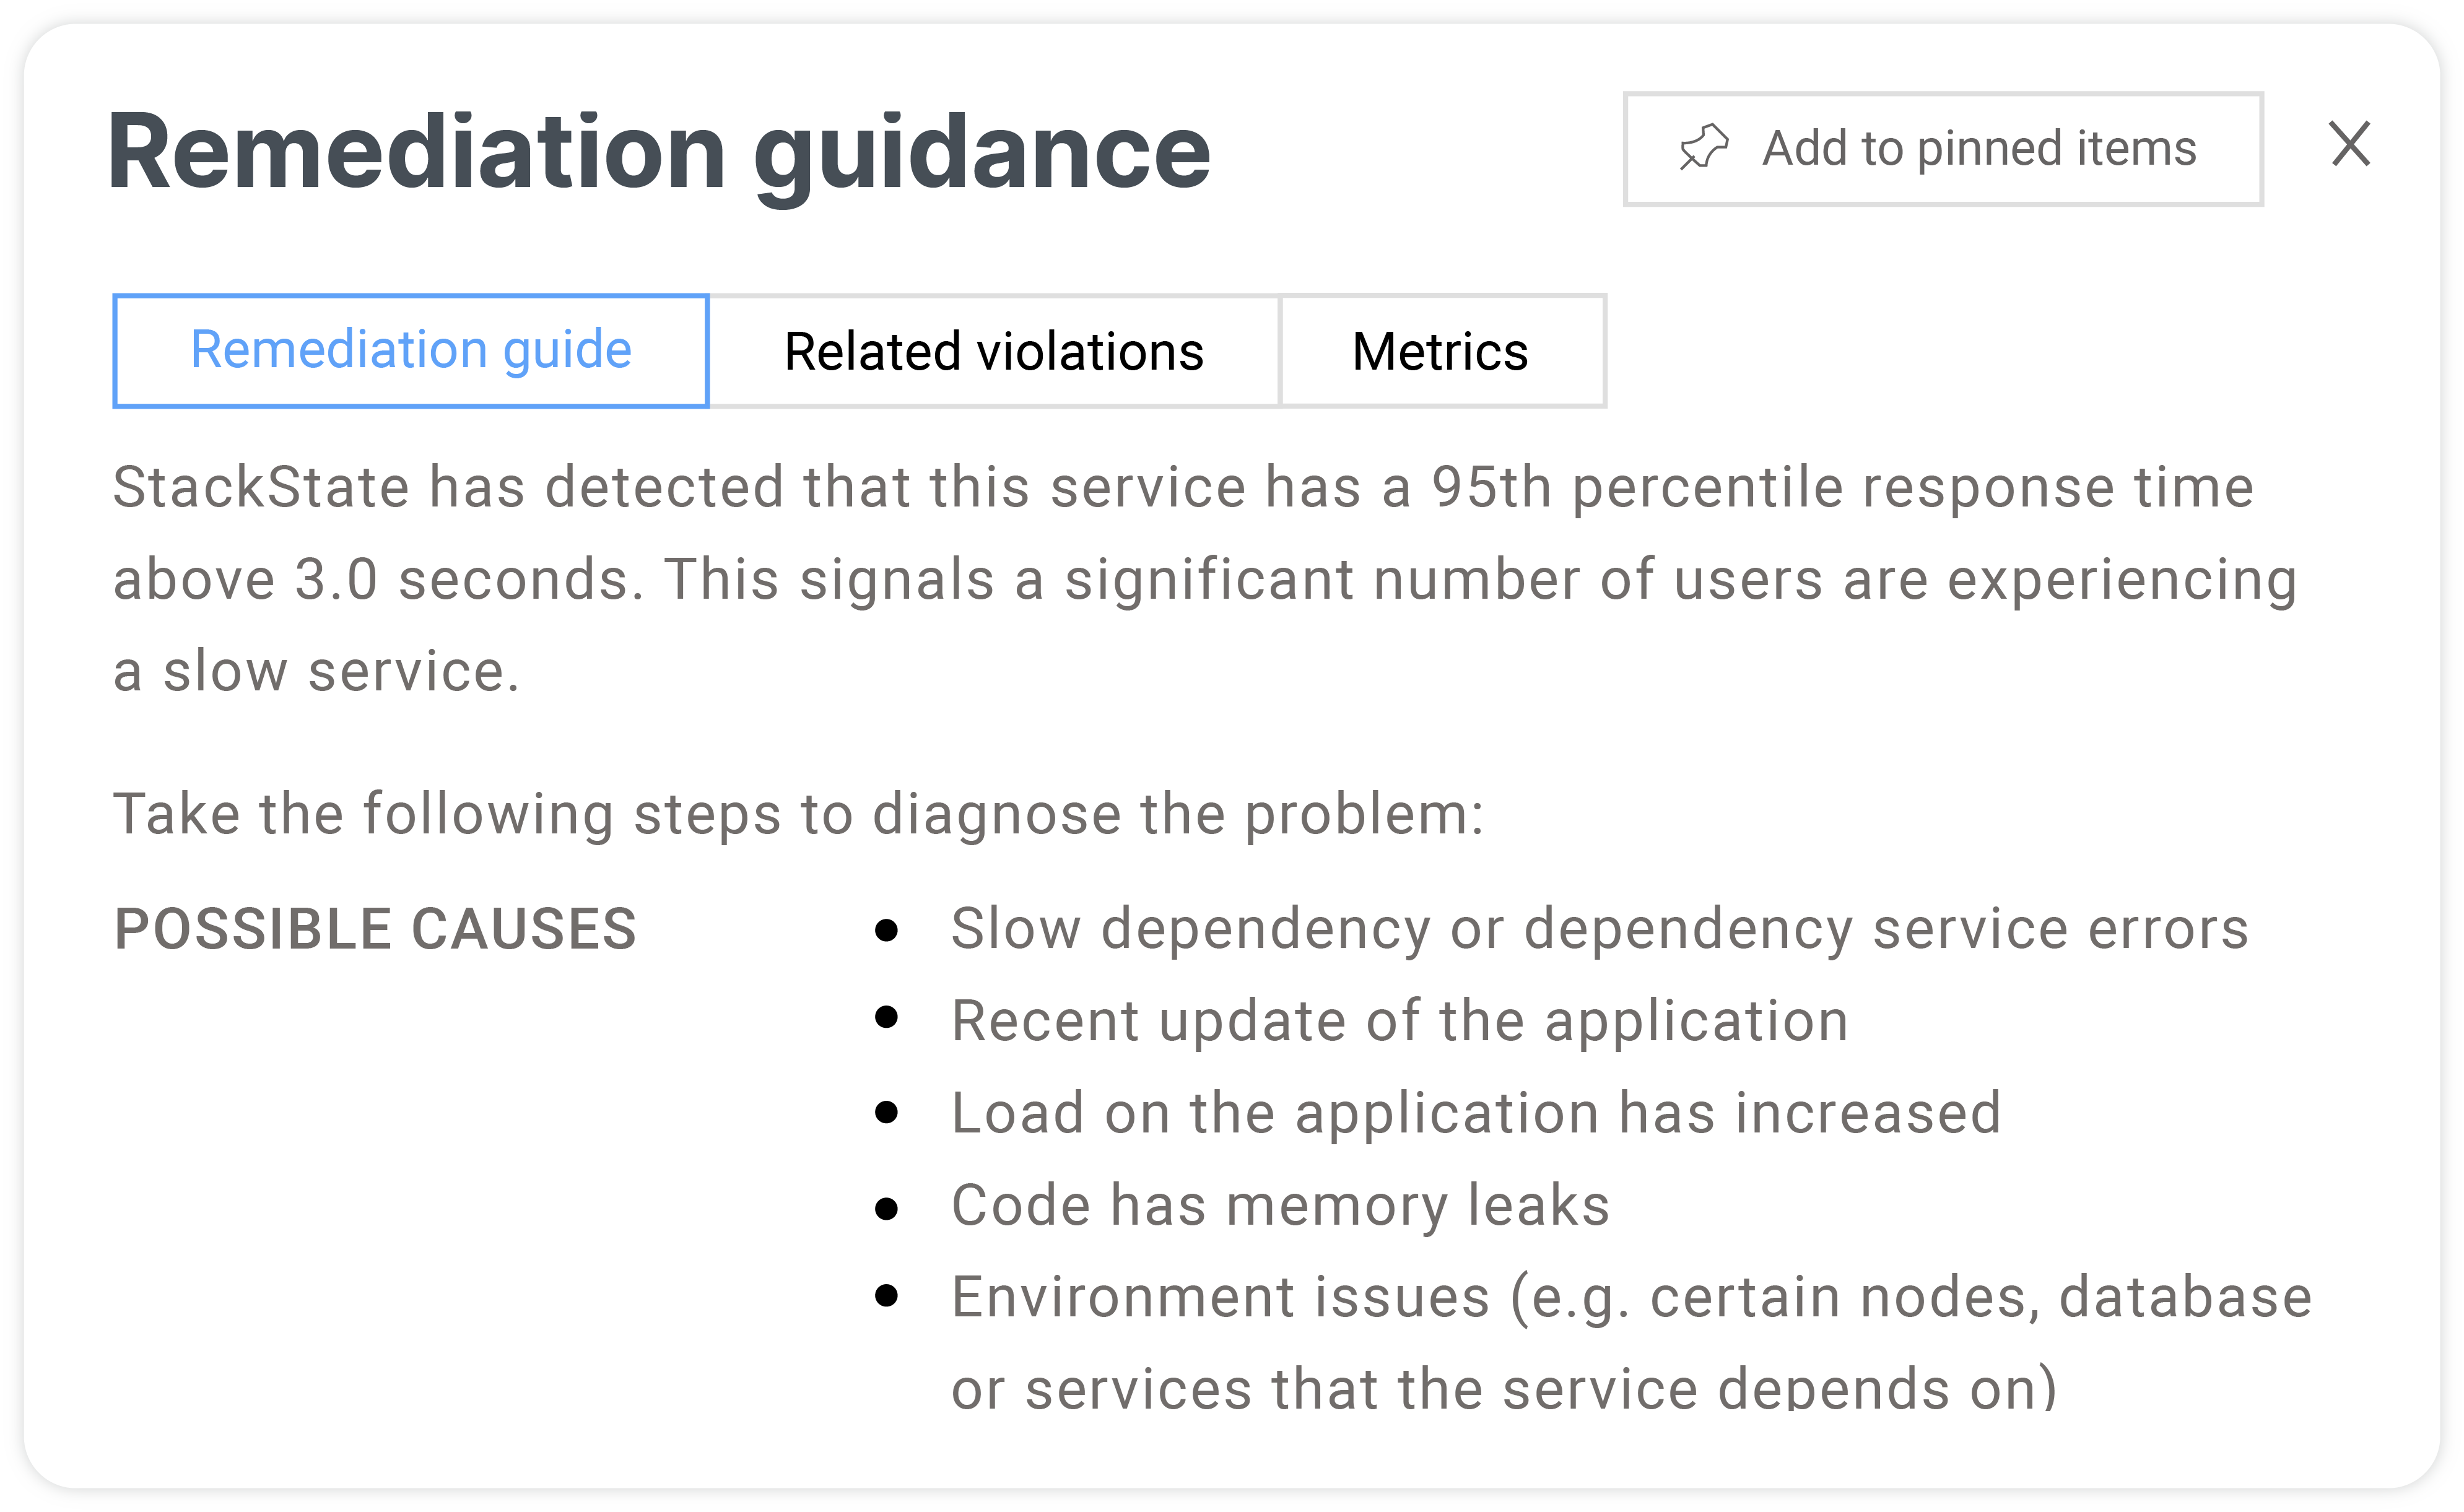
Empower SREs with guided remediation for developer-driven service excellence
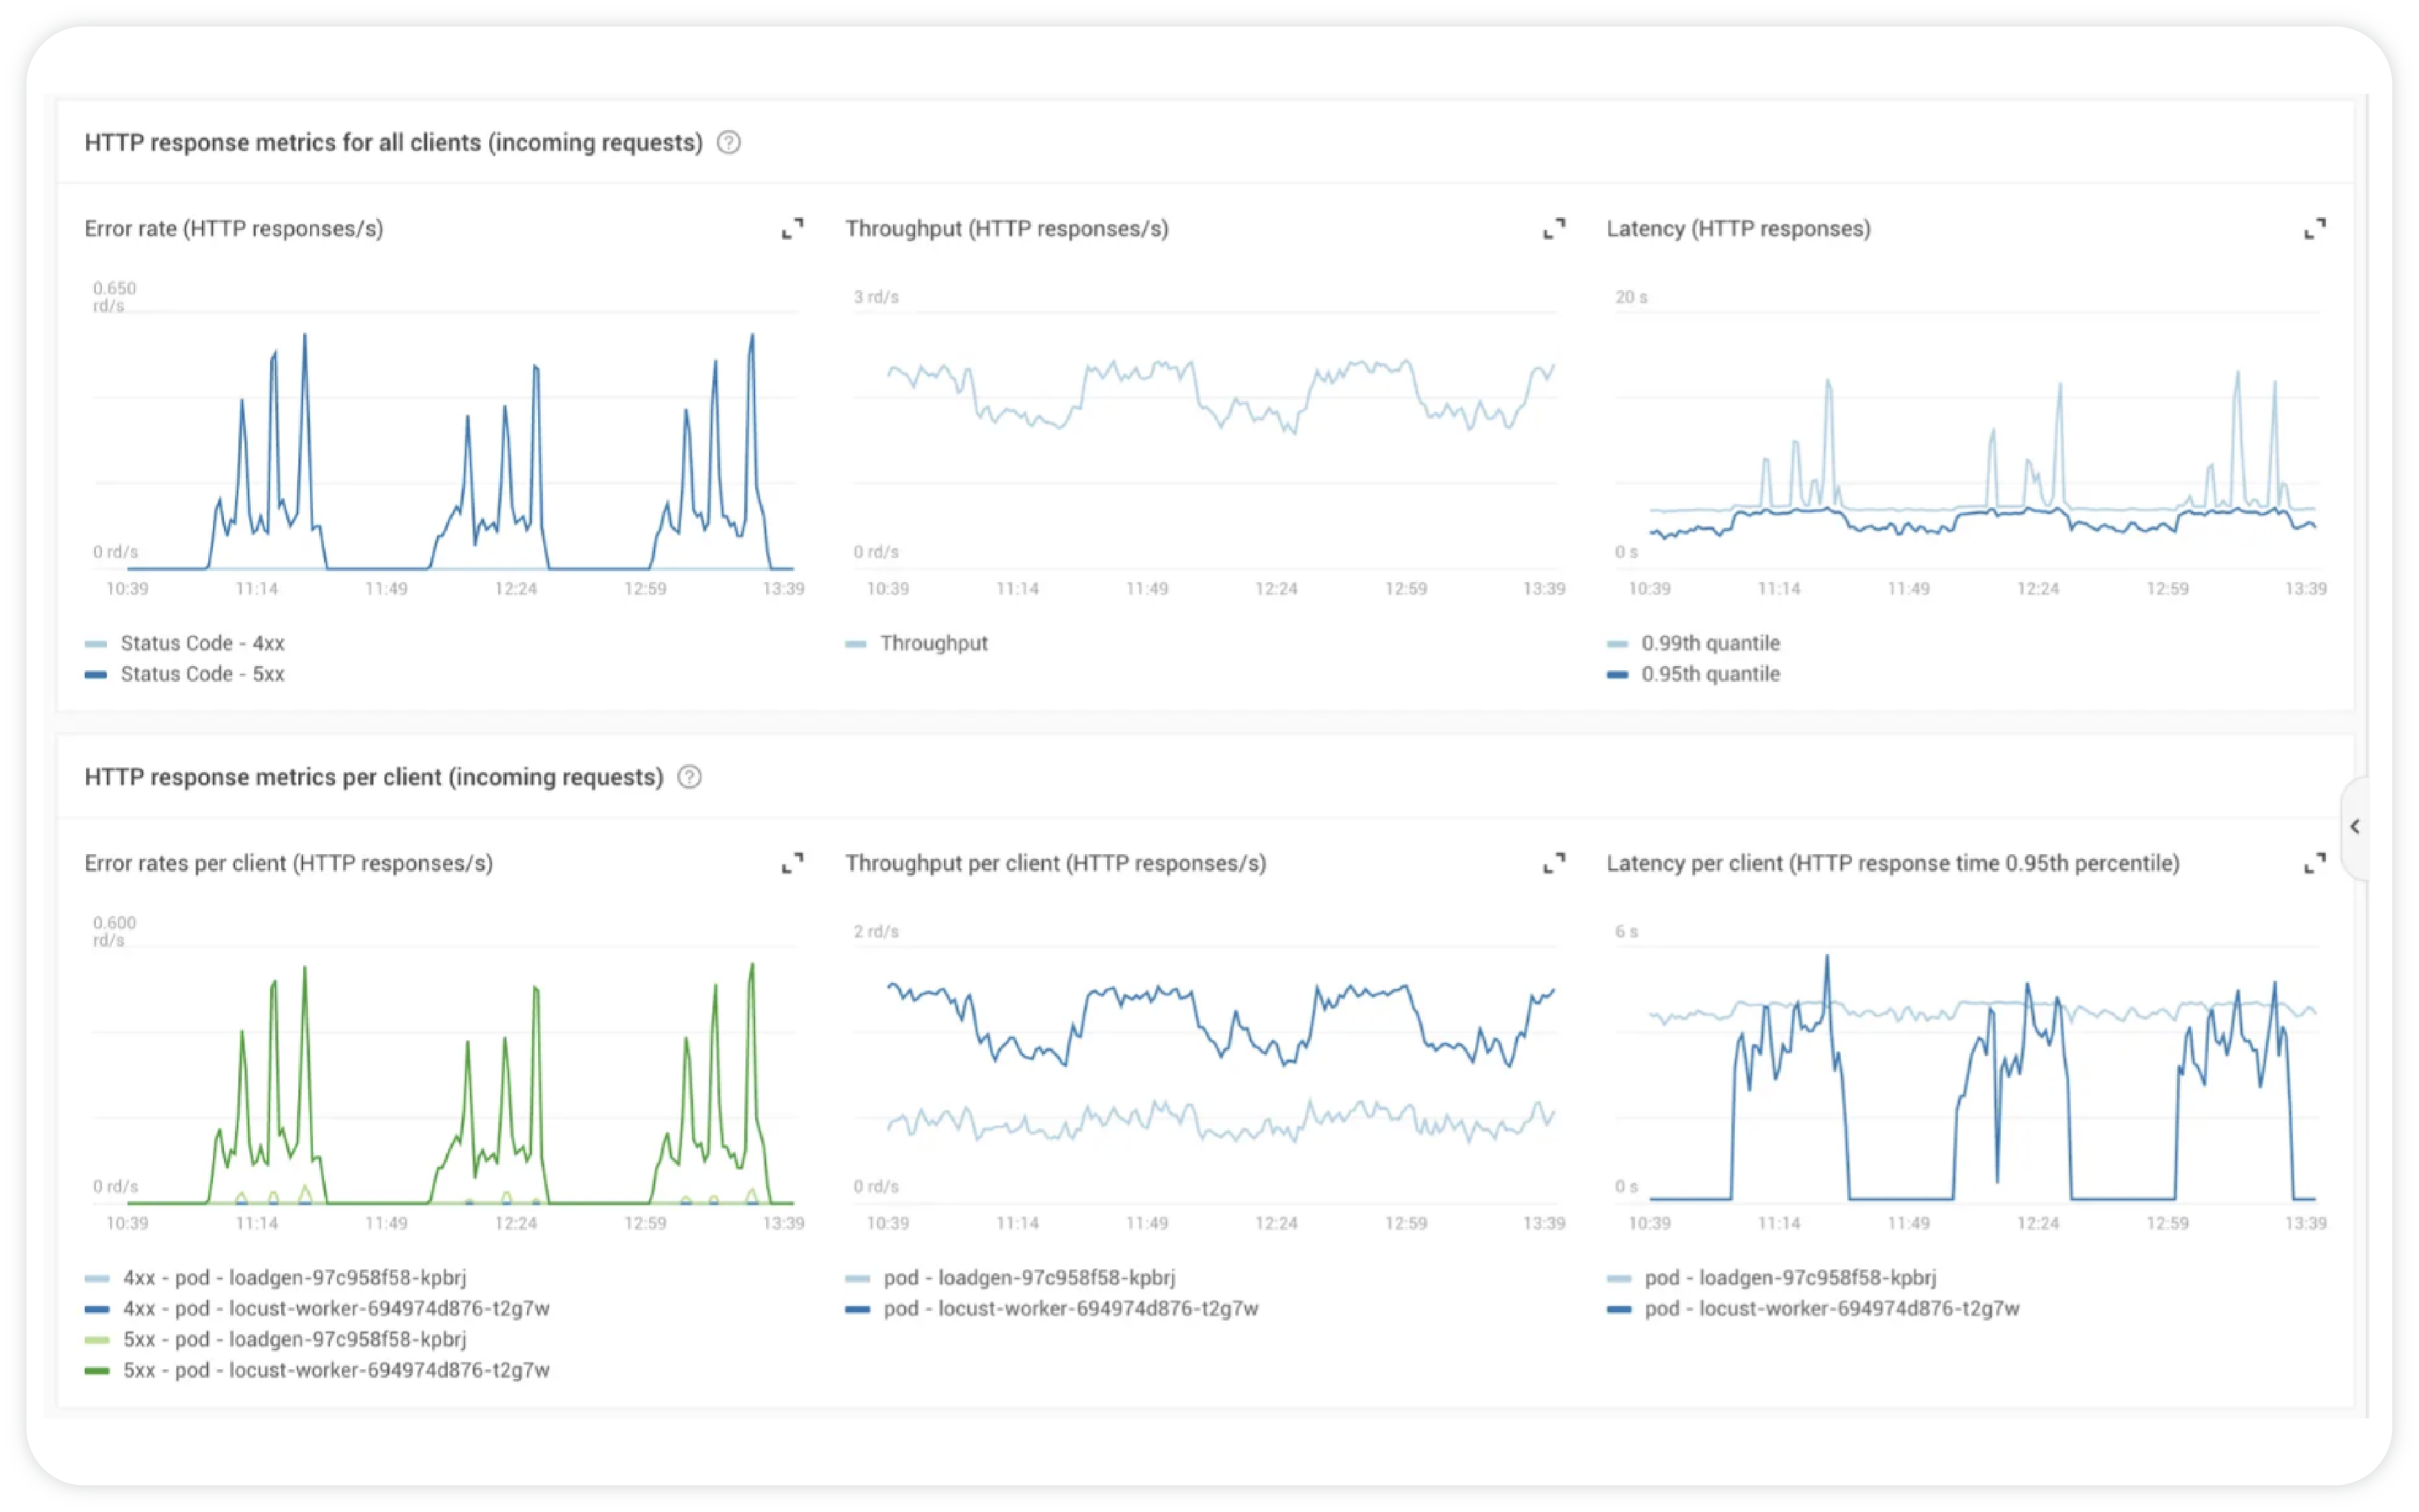
Simplify troubleshooting by eliminating multiple tools, allowing teams to focus on minimizing service impact