
Imagine the following situation:
You are on call, and your monitoring dashboard has flickering red lights due to an increased number of 5xx HTTP responses from one or more of your Kubernetes services. Now it is time to start to troubleshoot 500 Errors. Instead of panicking, you can use this blog as a guide.
What are 5XX Errors?
Error 500, also known as the Internal Server Error, is a common HTTP status code that indicates an issue on the web server’s side. When you encounter an Error 500, it means that the server has encountered an unexpected condition or configuration problem that prevents it from fulfilling the request made by the browser or client.
And that is bad news when customers are relying on your Kubernetes applications. Quick remediation of these errors is critical because providing reliable applications to your end users is important, and applications that produce a lot of 500 Errors put reliability at risk.
But the good news is that this guide will provide the steps you need to take to correct HTTP 500 Errors in your Kubernetes-based applications. We'll also look at various causes of these errors and provide you with easier ways to remediate them.
Why is troubleshooting HTTP 500 Errors so important?
One of the core questions of application performance monitoring is: What should we monitor? If the end goal of monitoring is to ensure a great customer experience, the availability of the deployed application is one of the most important things to keep an eye on.
A critical metric to monitor is the number of erroneous responses from an exposed HTTP API service. Measured from the server side of the app, it tells you something about the end-user experience.
More specifically, observing the ratio of HTTP 500 responses to the total number of HTTP responses gives a volume-independent metric of the percentage of users connecting to a service experiencing reduced availability.
How to troubleshoot HTTP 500 Errors
Before you can remediate any issue, you first need to understand exactly what you're seeing across your applications. Then you can take the next step and diagnose the problem. Accurate remediation will be your third and final step.
Triage: Understand how the active failures are related
In today's world of microservices and service-oriented architecture (SOA), an issue never stands alone. For this reason, it is crucial to get an overview of the broader context in which the 500 responses occur. This helps reveal how active issues are related and where to focus your efforts during the investigation. It's equally important to gain context around this failure to understand how it might propagate and affect other services.
The image below gives a concrete example of how context can be visualized. The example shows a microservices application running on Kubernetes, with various services experiencing issues. The arrows in the diagram show which services are impacting each other.
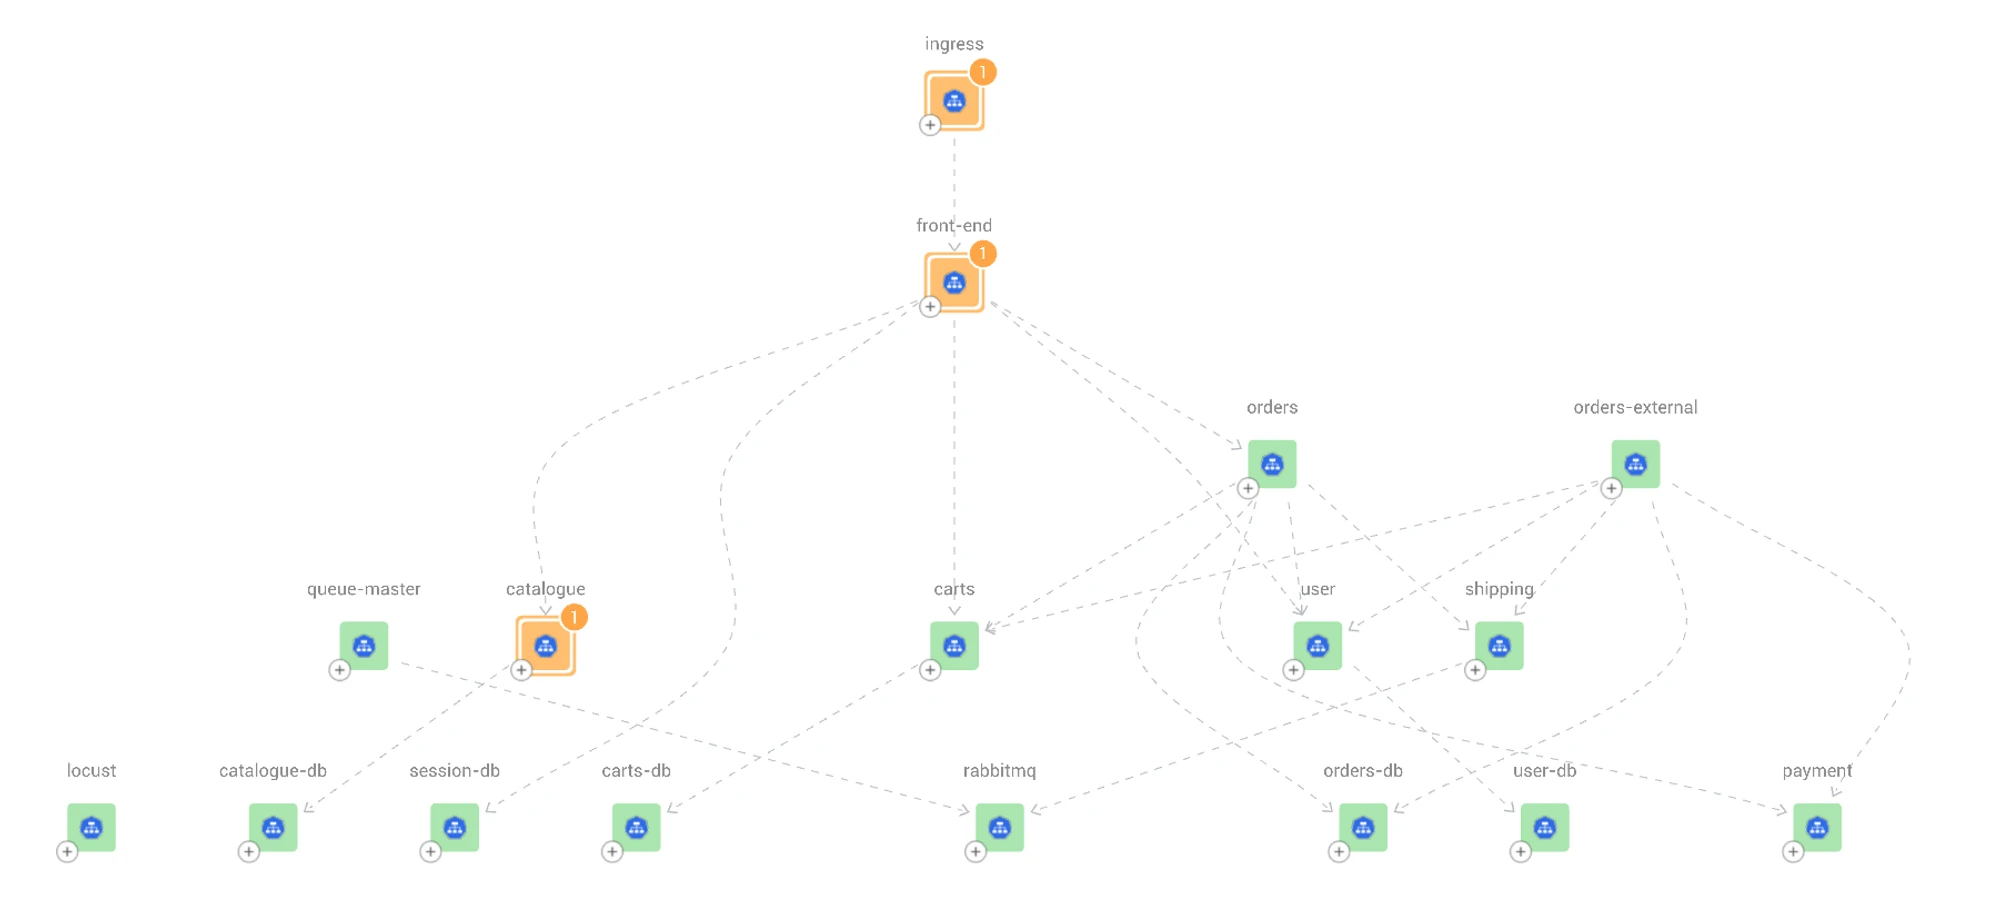
In the example above, the catalogue service is impacting the front-end service of the application, which in turn impacts the ingress. We can clearly see a chain of failure, although not all other services are experiencing actual failure.
Let's look deeper to understand where the failure is coming from.
The ingress (consumer-facing entry point to access your application or service) is being serviced by the front end, which in turn is being serviced by several other services (see orders, user, carts, etc.) that are mostly healthy. The catalogue service in this example appears to be the lowest component in the hierarchy experiencing failures above the allowed threshold, so it can be inferred that it is also why the services higher up are reporting failures.
There are two possible paths to investigate further.
Take a closer look at the ingress, front-end and catalogue services to gain more understanding of how the issue propagates through these services.
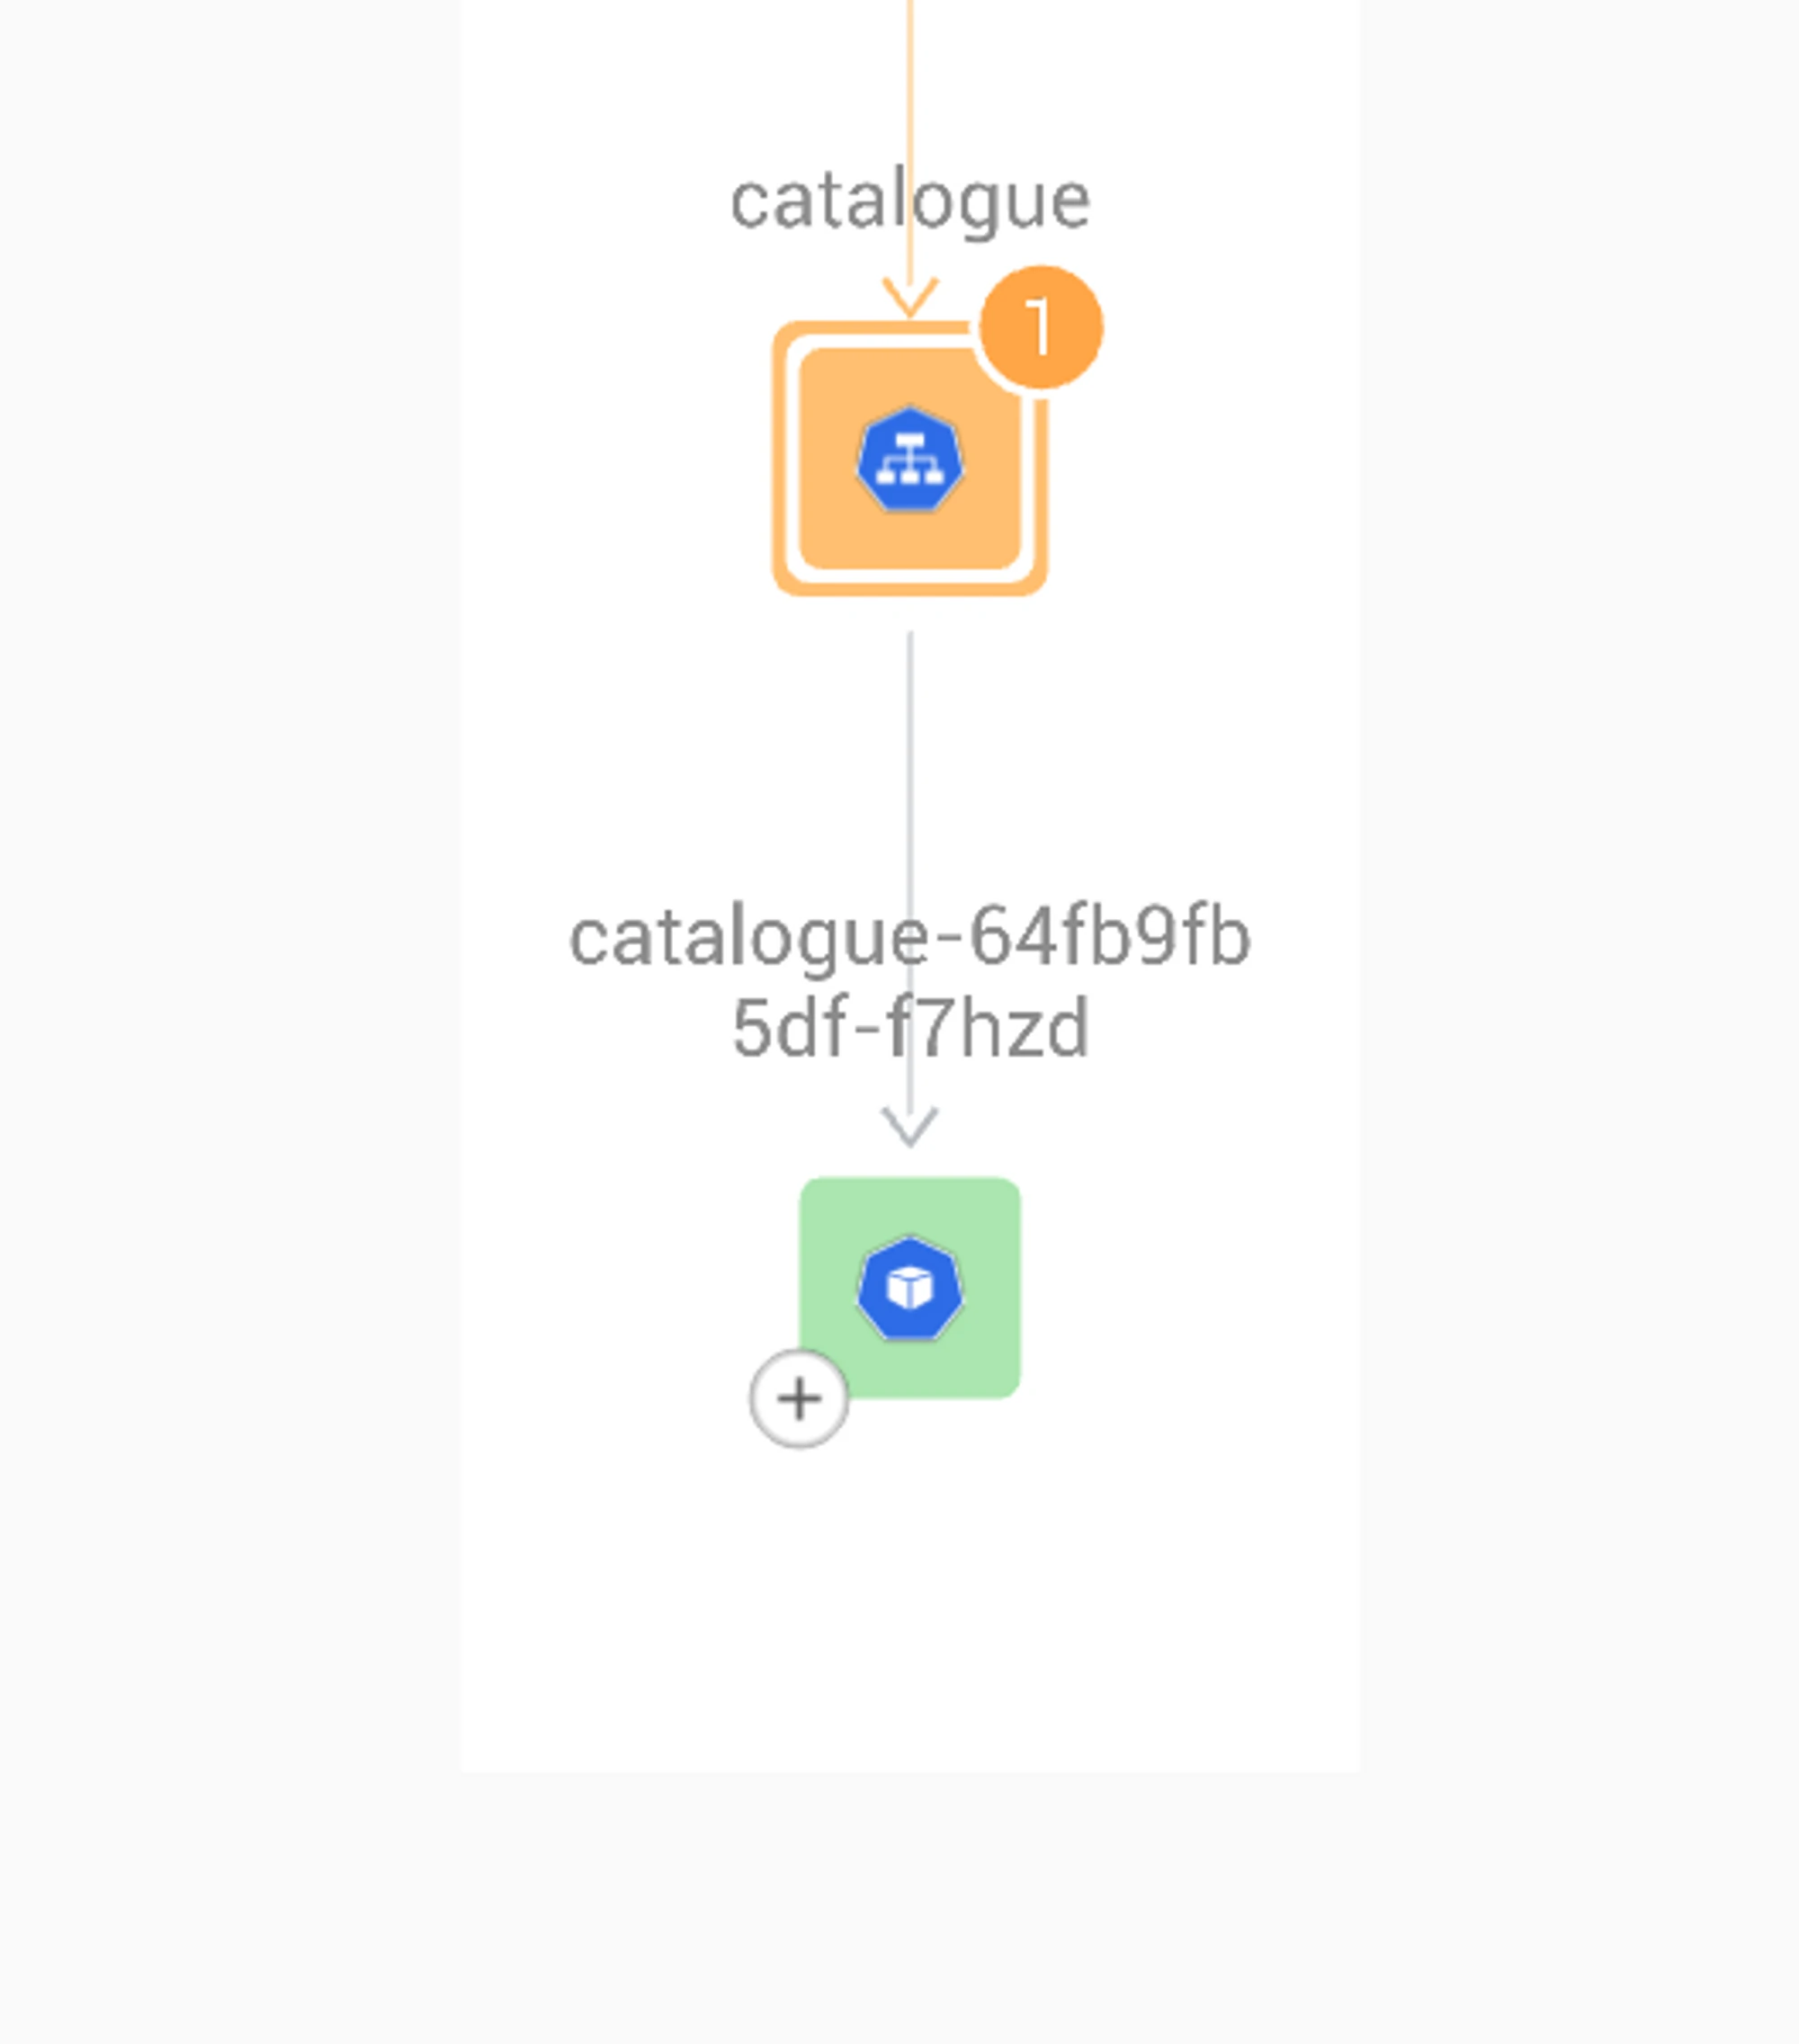
Assume the catalogue is at fault and start deepening the investigation to find the root cause and remediate it as soon as possible. Understanding the root cause does not stop at assessing the service level – it must go to the pod level. When a Kubernetes service is experiencing an increased percentage of 500 responses, the next step is to look at the pods exposed by that service.
Common Issues exposed in a triage
A pod can have many causes that result in 500 responses. Here’s a list of common issues and checks to perform to resolve the issue.
A recent redeployment of the pod contained a change that broke the pod.
Check for recent deployments: You can use commands like kubectl rollout history or kubectl get deployments to check the history of deployments and determine if there were any recent changes. If you think this is the cause, the first step should be to perform a rollback to the latest version that worked, after which a more thorough investigation can be started to see what change was the culprit.The pod does not scale appropriately.
Check the pod's resource usage: By inspecting the resource usage of the affected pods, you can identify if there are any signs of resource contention. For example, if the pods are consuming a large amount of CPU or memory, this can indicate that the service is not scaled correctly. Use kubectl top pod <pod-name> to show the CPU usage of the pod. High CPU usage may indicate improper scaling, in which case the first step is to scale up the number of pods. If that fixes the problem, you can conduct a more thorough investigation to determine what caused the increased load.Uncertainty around the cause of the issue.
Sometimes there is no clear clue on the cause of the issue. Check for errors in the pod logs: When a pod produces a 500 response, a good practice is to leave a message in the log with more information about what caused the 500. Inspect the logs of the pod using kubectl logs <pod-name>. The next step in the investigation will depend on what errors were found in the logs.
Troubleshooting the StackState way
Our innovative Kubernetes troubleshooting solution allows you to easily tackle HTTP 500 Errors in your Kubernetes-based applications. We provide out-of-the box monitors that automatically alert you about the most critical issues while visually mapping out ongoing problems. StackState then delivers automated, comprehensive guidance to resolve these issues efficiently.
StackState also enhances every step of the troubleshooting process by collecting accurate and comprehensive information and providing visual troubleshooting hints. And we alleviate the need for multiple tools to troubleshoot a single issue. Best of all, StackStates curates the data and provides you with remediation guides to help you quickly solve the problem.
Let’s take a close look at some of the core capabilities.
The trigger for action: Automated detection of 500 Errors
Monitors are pre-defined measures that continuously validate any resource type and behavior in your cluster. Various monitors are packaged and pre-configured in StackState.
All teams that start deploying their applications to Kubernetes will get monitors automatically applied. Any SRE that wants to extend and enhance monitors can do so through our YAML-based monitor definitions, or they can drop us a message so we can extend it for them.
One a pre-configured monitor detects any 500 error in your cluster, it will flag situations that are not compliant with the following rule:
Monitor that the number of HTTP responses with status code 500 relative to the total responses stays below 5% for a K8s service.
These 500 monitors help teams to provide a more reliable customer experience.
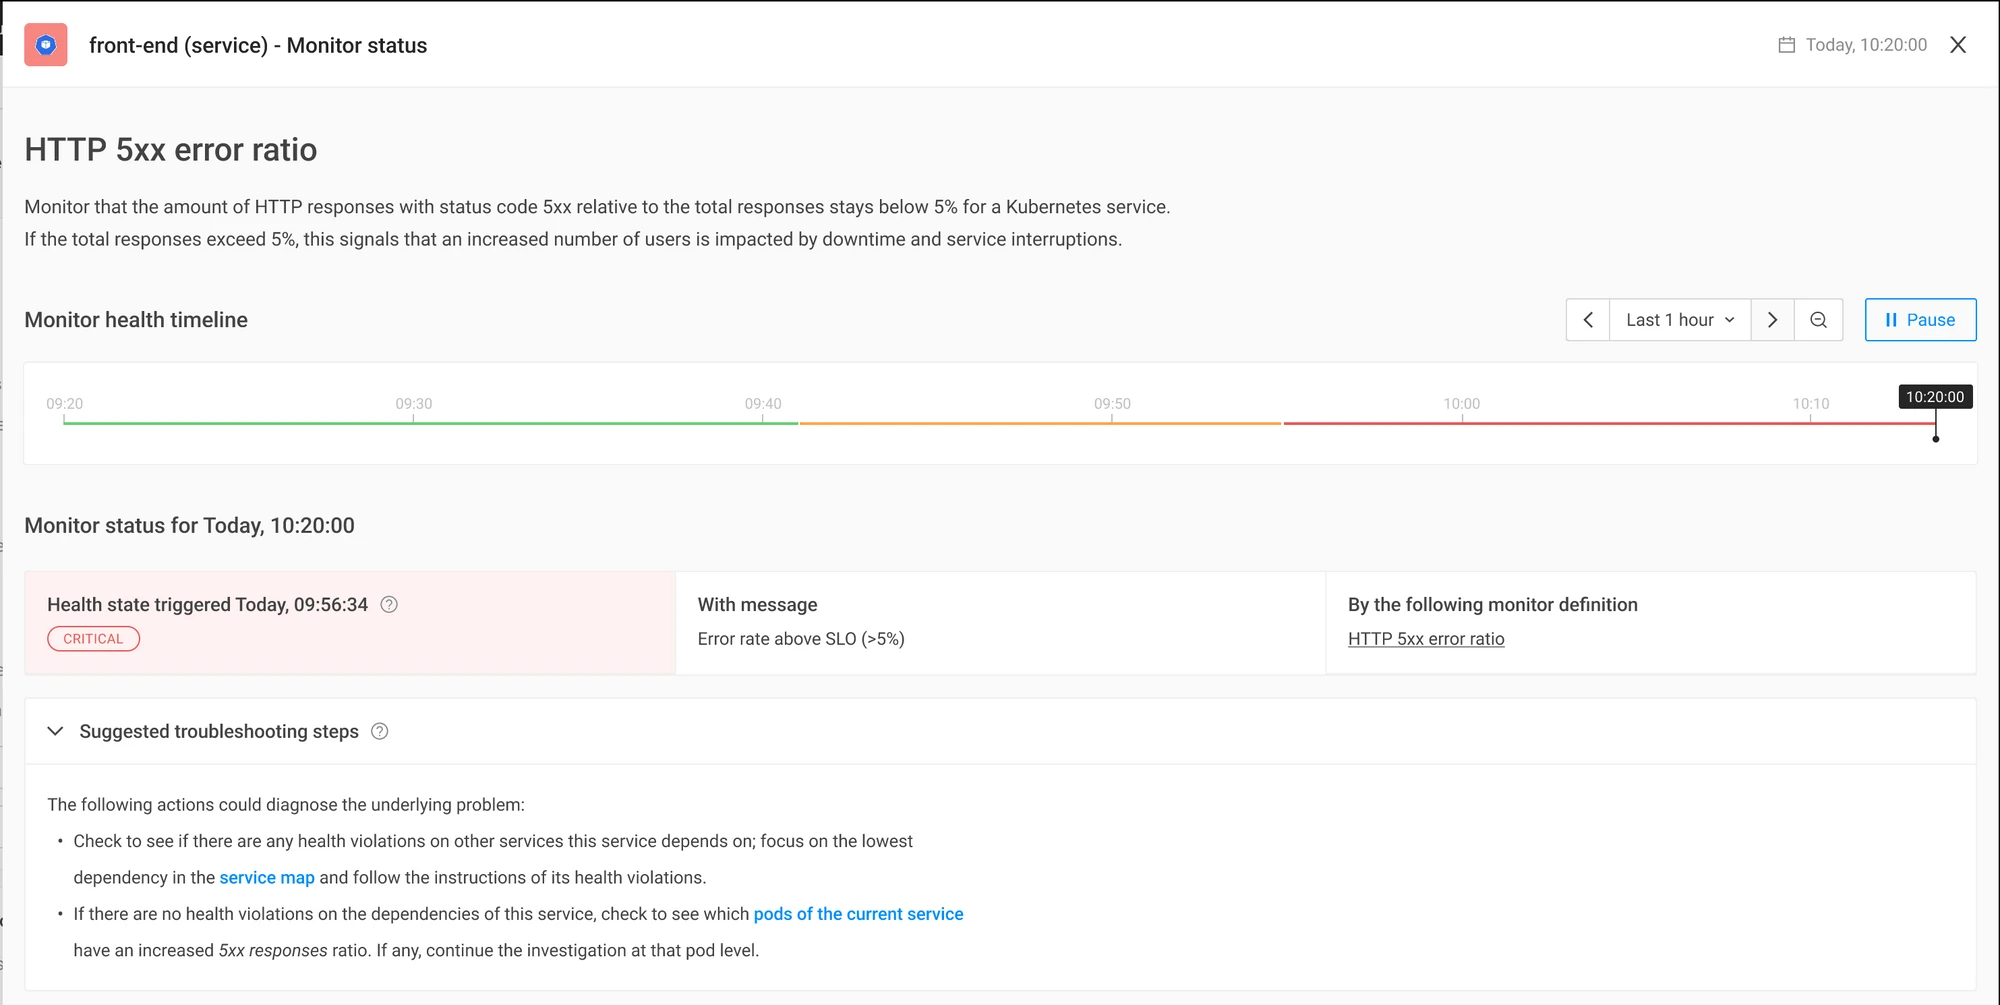
Step 1: Evaluate the issue using the troubleshooting steps provided on the alert landing page
Once a problem is flagged, you want to triage it quickly and accurately. StackState has detailed alert pages that will provide you with all the details needed to understand what is happening. The Alert page provides:
The problem description
The problem characteristics
Remediation guidance
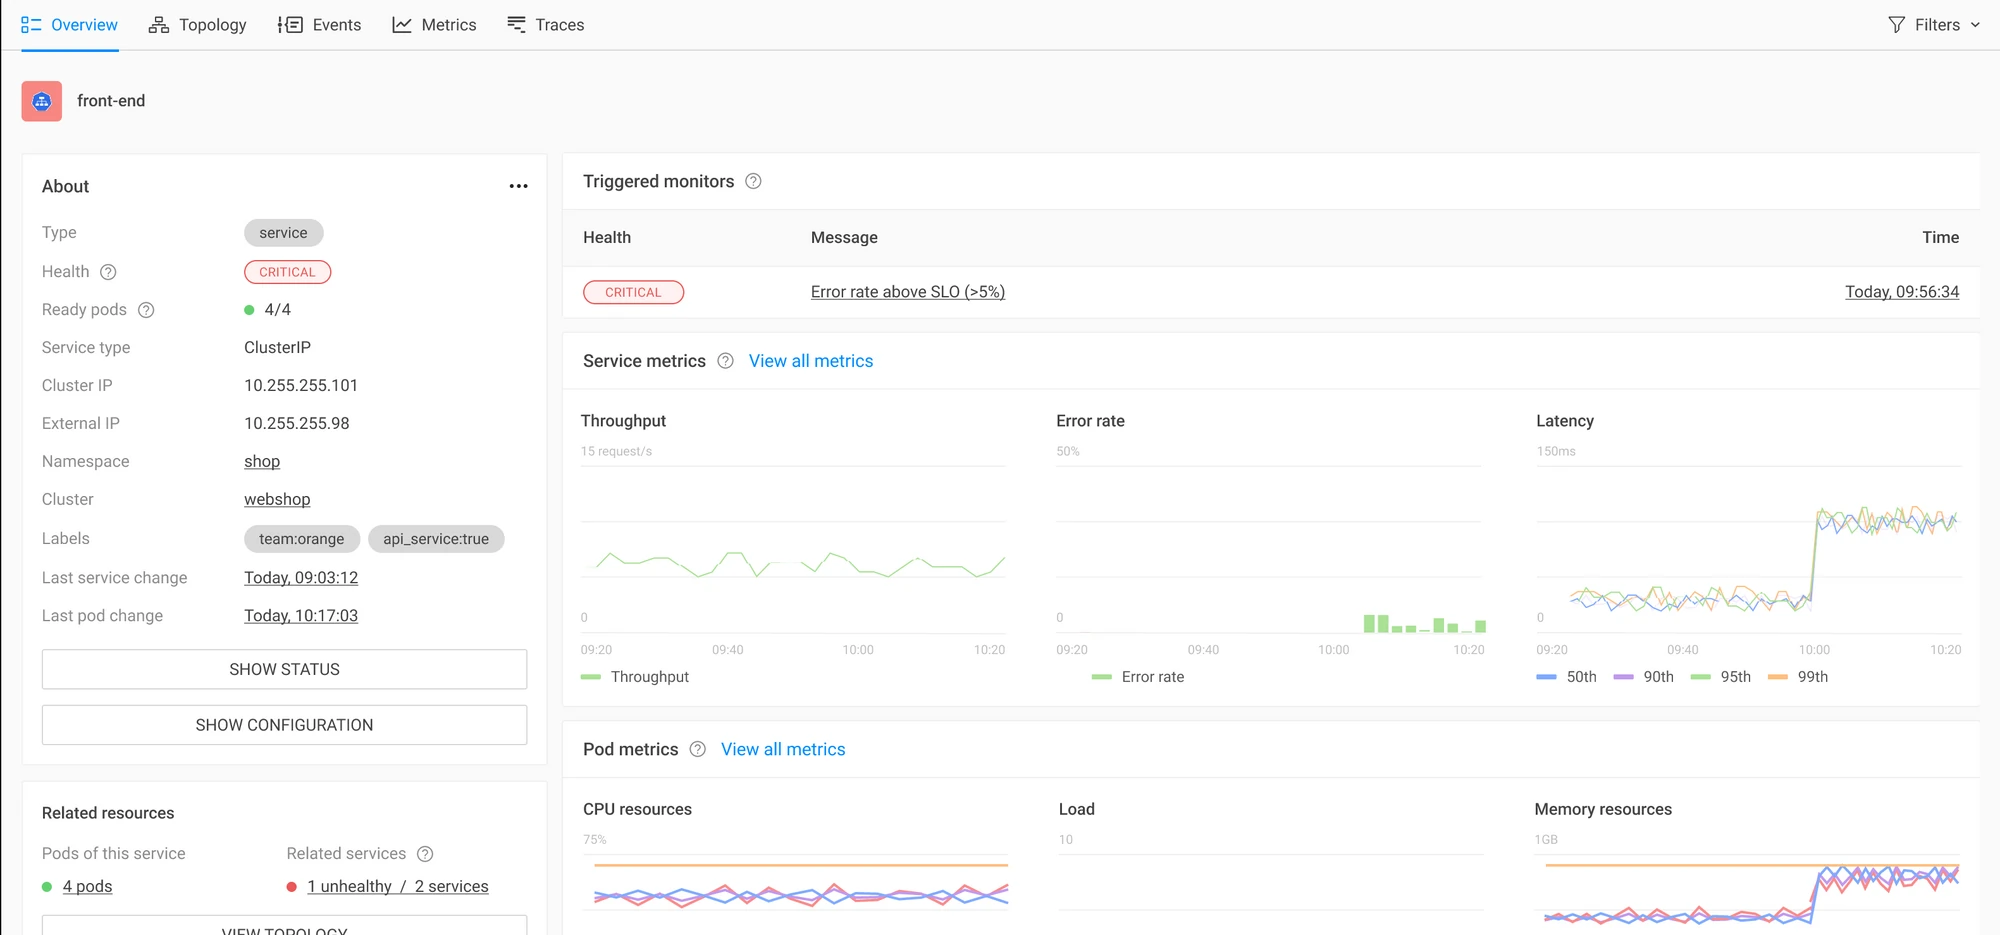
Step 2: Examine the issue utilizing StackState’s extensive context
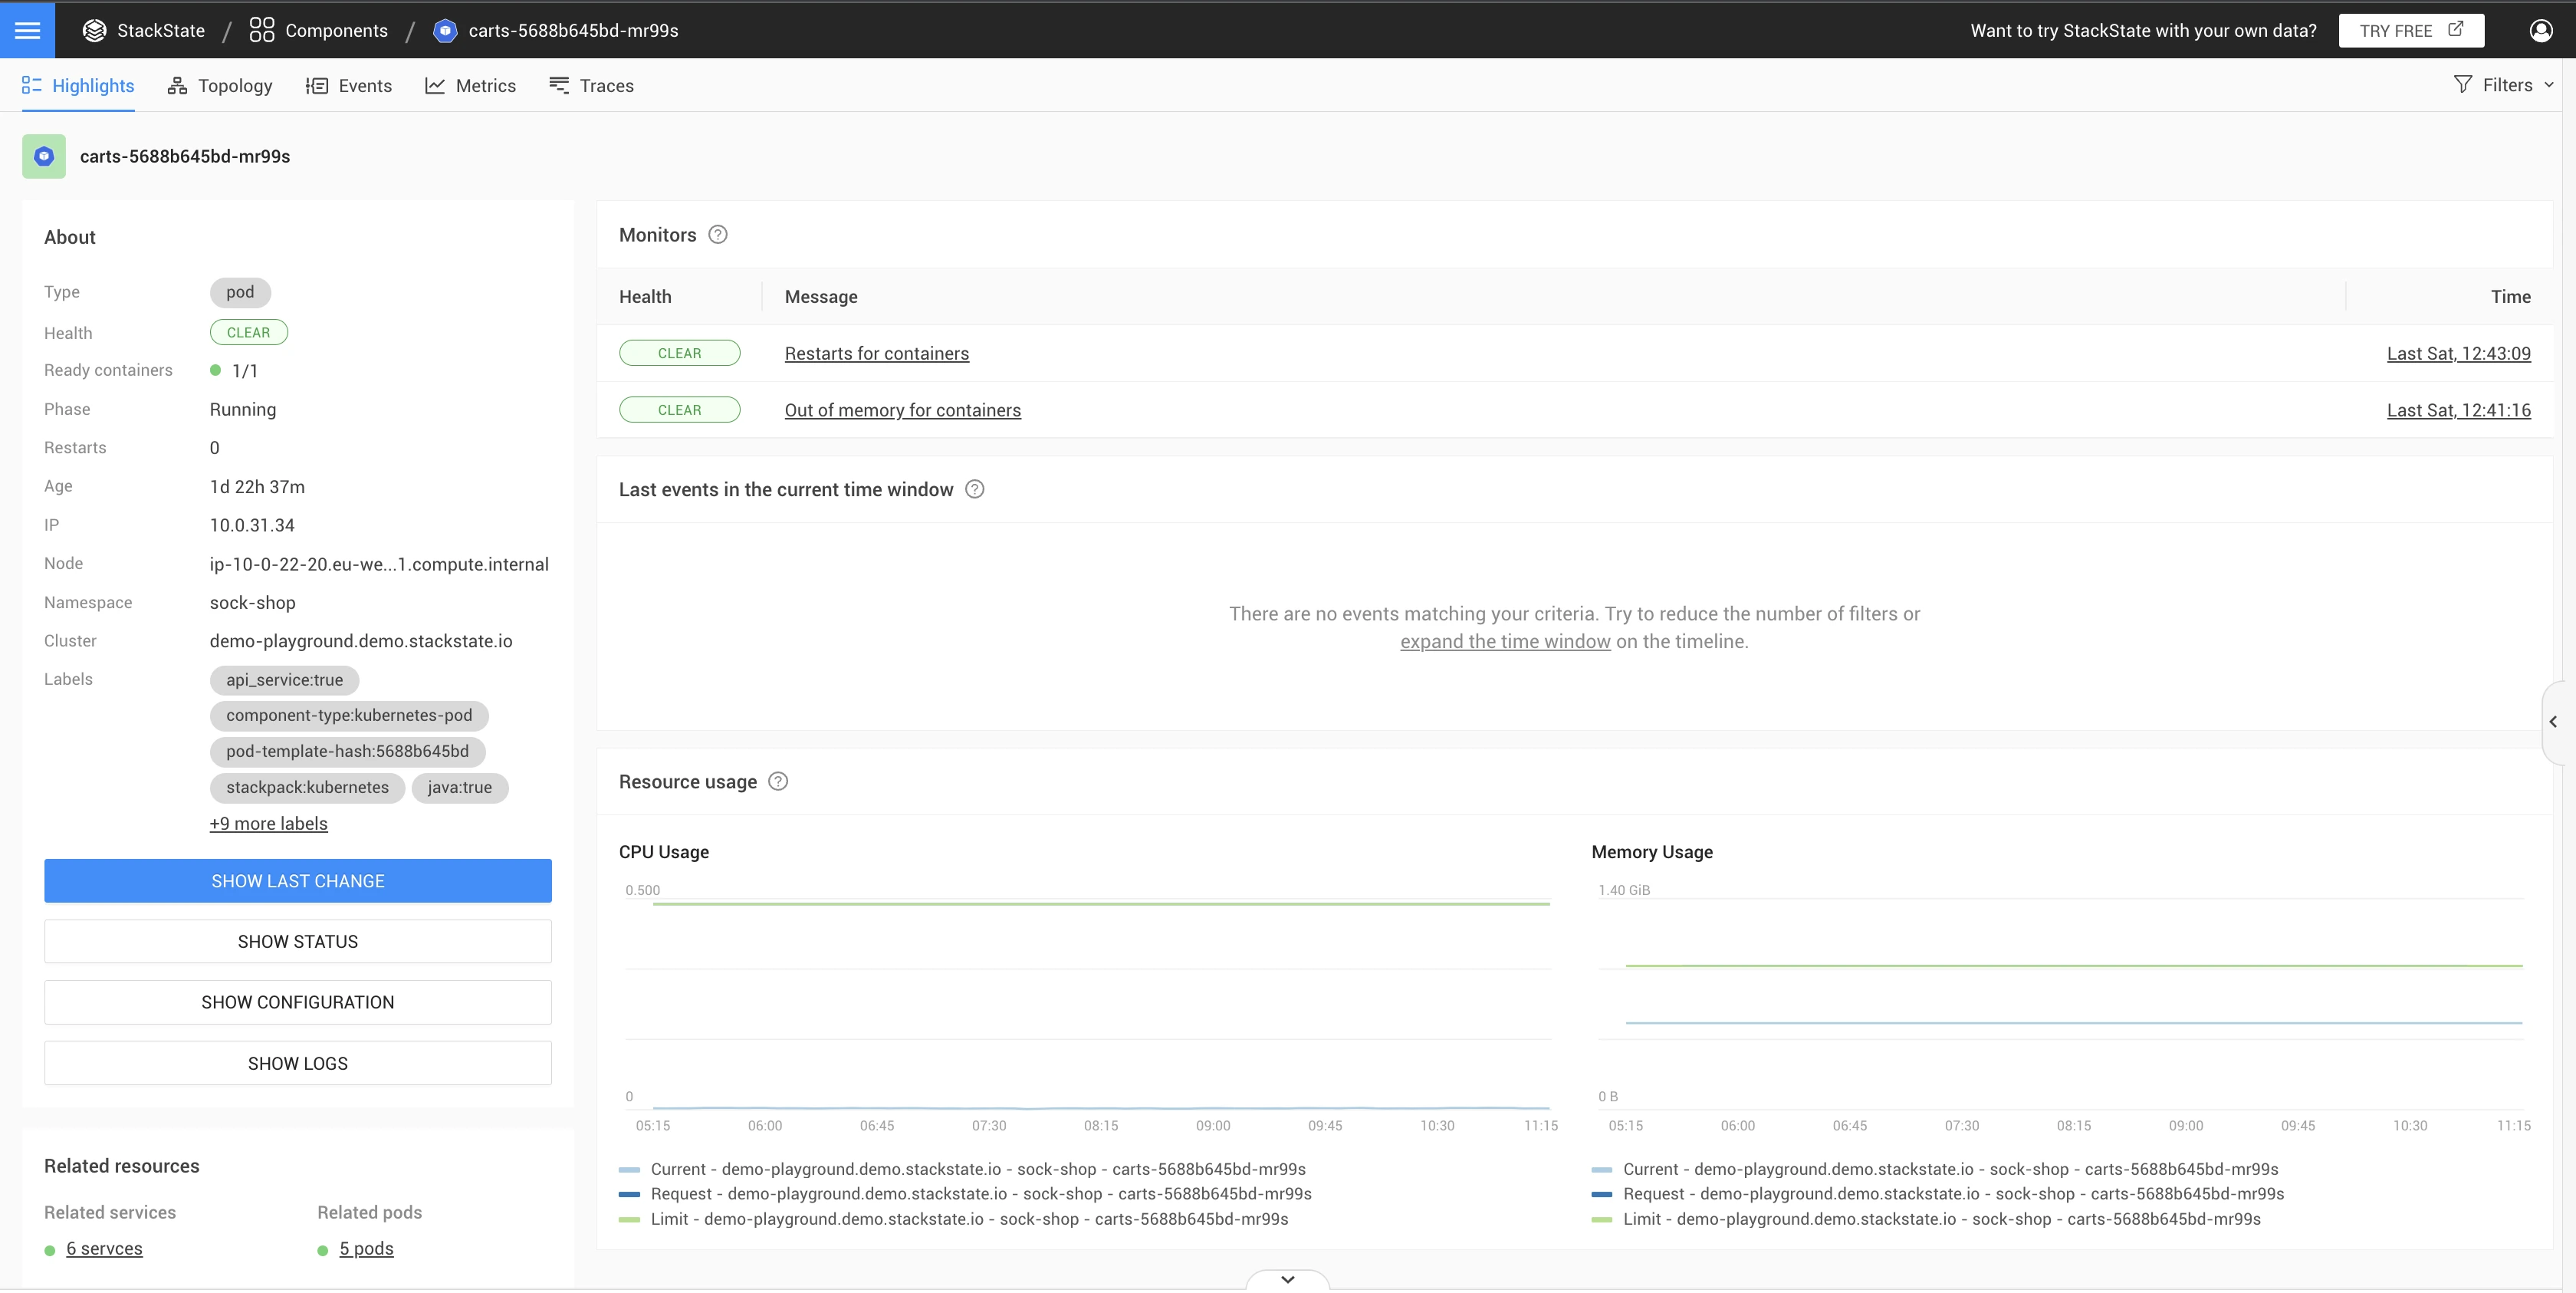
Sometimes an issue requires further inspection, and more data is needed. In StackState, all information relevant to a particular service is already gathered and brought together in the Service Detail page. No need to switch between many other tools; it's all right there for you.
The Service Detail page provides:
All service details, like status and configuration
All relevant service metrics, including the related pod metrics
1-click insight into the associated resources
If the service you are looking at does not provide enough details, you can use our dependency maps to see detailed information about dependent services. See the image in the first section of this post for an example.
Step 3: Diagnose: Deepen the investigation of a single alert
Using the related resources on the Service Detail page, you can detect the pod with the issue in a single click.
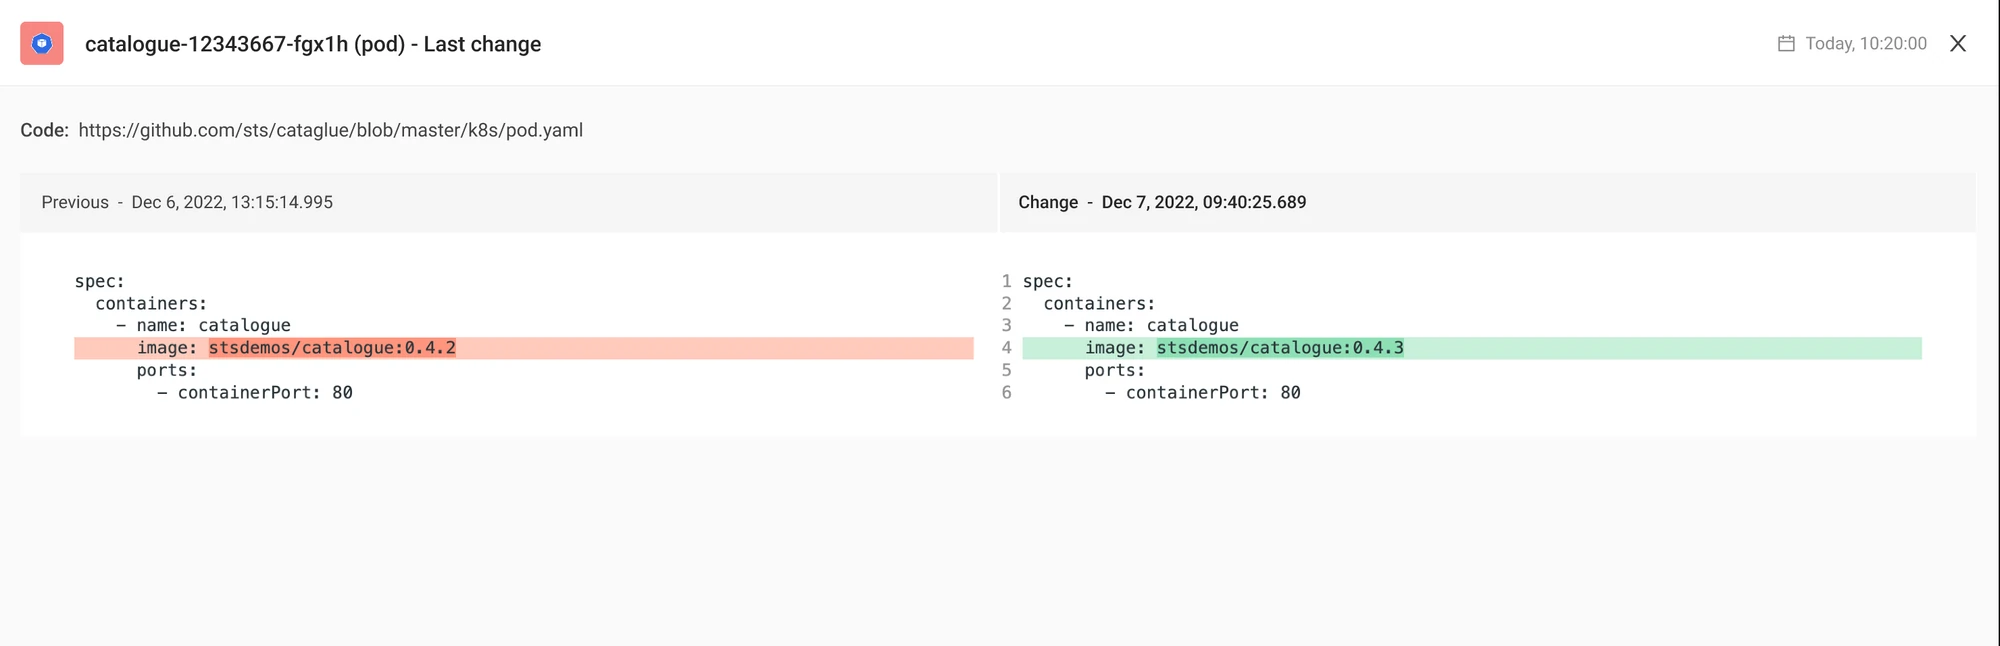
The relevant data for the pod is already collected and correlated, so you do not need to use different tools to find what you need. The Pod Detail page shows configuration changes, logs, metrics and monitors. This allows you to assess the last moment a new version of the pod was deployed. If the deployment and alerted monitor occurs at the same time, this might be the cause of the issue.
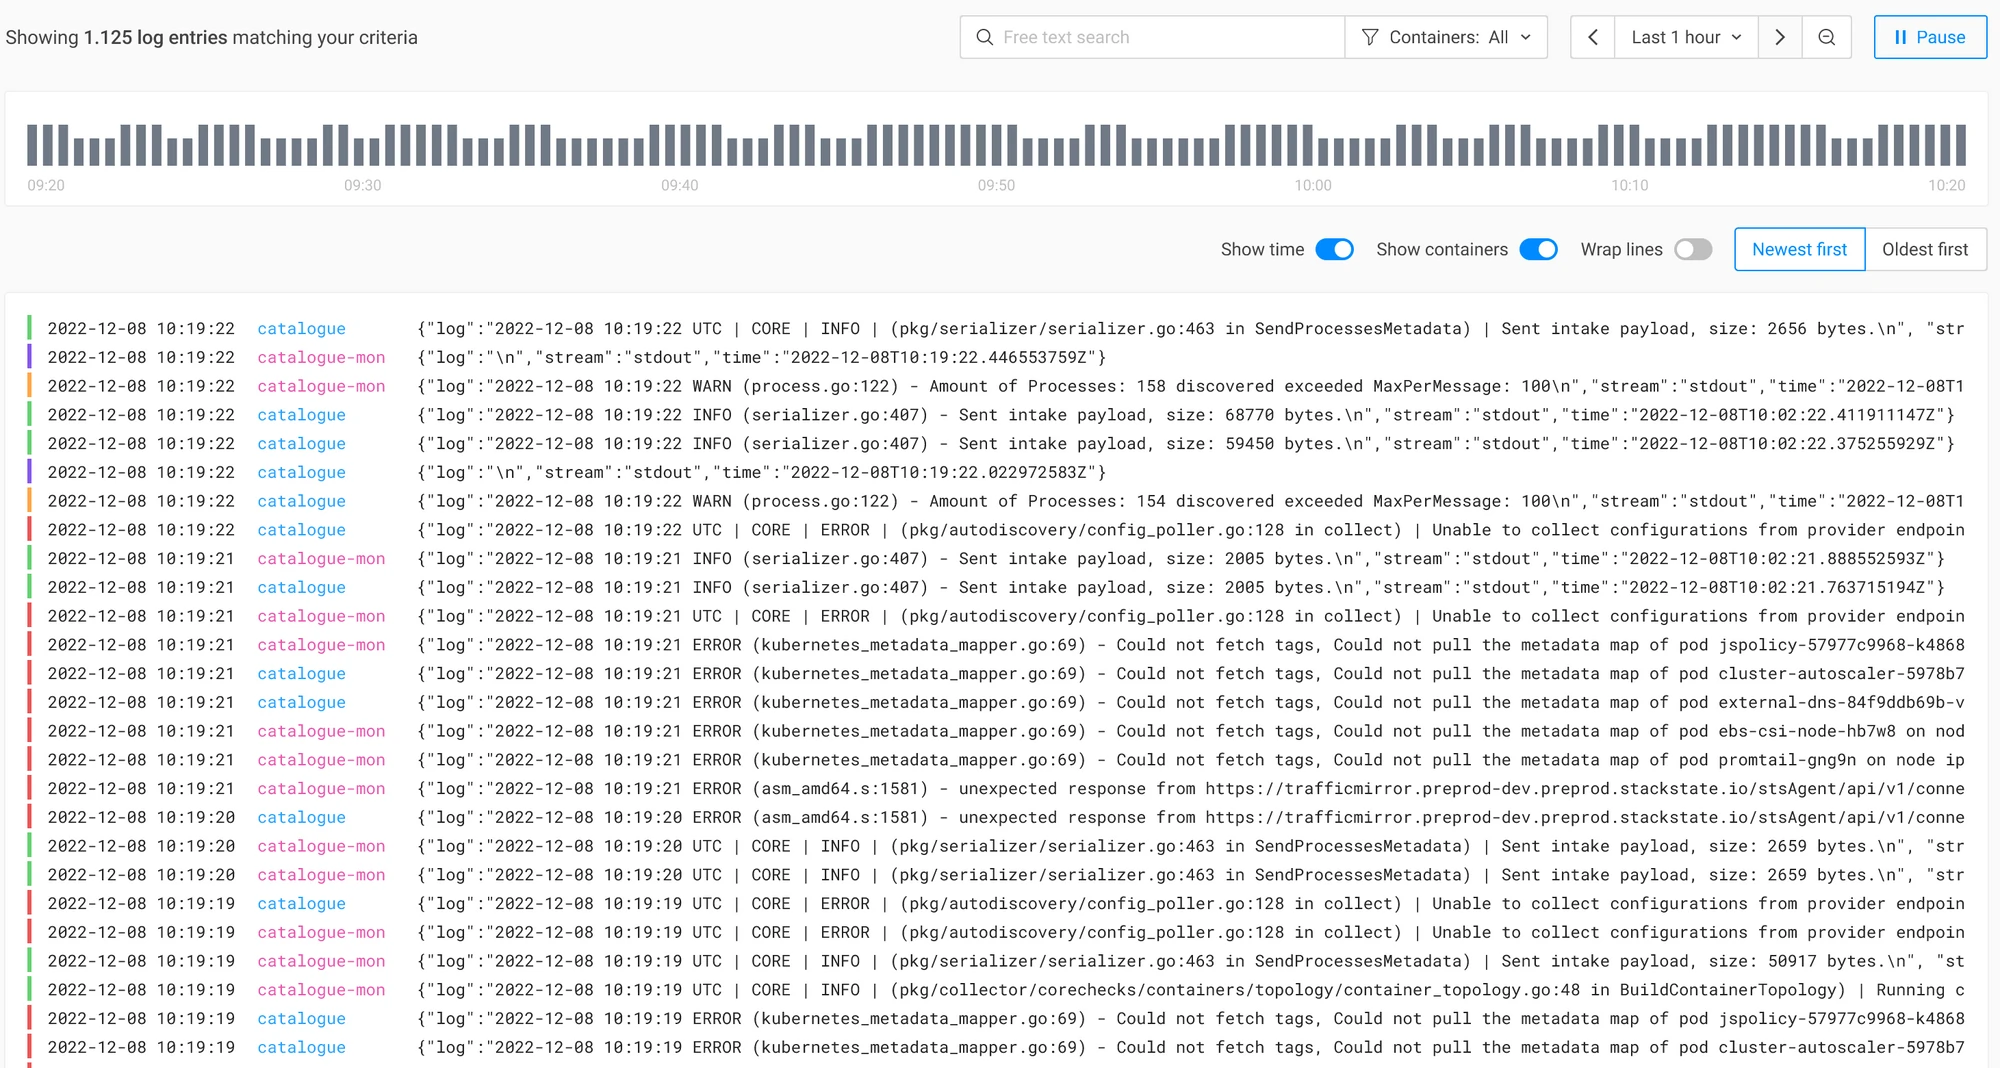
Logs are already retrieved for you; simply review them to detect any errors.
Make use of the metrics to identify if the pod is scaled appropriately, with the expected amount of containers ready.
Note: In addition to this 500 issue, the pod might contain additional alerts from other monitors that will guide you to the cause of the issue.
Data collection
All the troubleshooting steps described above are possible through the StackState agent, which supports out-of-the-box protocol detection. This means that it is possible to inspect the HTTP requests and responses for an application without requiring a change to the application. Once you install the StackState agent, monitoring 500 responses can be done by every engineer, providing an easy way to keep an eye on the availability of any deployed Kubernetes application.
Summary
In conclusion, troubleshooting HTTP 500 Errors is crucial in ensuring the availability of your deployed application to end users. Remember the following:
When dealing with an increased number of 500 HTTP responses, it's important to understand the context and relationships between resources and investigate individual services affected.
With pre-configured monitors and visual mapping of service interdependencies, StackState provides a unique approach to tackling these troubleshooting issues.
If you want to explore how you can troubleshoot HTTP 500 errors yourself, visit our playground .
Or why not test our service with your own data by signing up for a free trial today.
About StackState
StackState is designed to help engineers and developers quickly identify and resolve issues in their Kubernetes-based applications. With features like real-time visualization, integrated monitors, guided remediation and time travel capabilities, StackState provides a comprehensive solution to streamline Kubernetes troubleshooting and improve system reliability.


