Application availability and performance are key for business survival. IT is not “back office” anymore, but an essential part of gaining competitive advantage and a key instrument to neutralize aggressive disruptors in the marketplace. Where Shakespeare used to say: “To be or not to be,” it is now “disrupt, or be disrupted.”
So, companies feel the urge to move faster and embrace DevOps and the agile way of working. They have no choice! Teams become more self-sufficient and have the freedom to choose the tools they think can help them the best. And that’s fine – without this, they wouldn’t be able to do their jobs right.
However, the diversity of all these different tools makes it even harder to find the root cause of a business-critical issue: “Help! My payment service isn’t working anymore! What went wrong, when and where?”. This typically implies a long mean time to repair, which is something no one can really afford anymore.
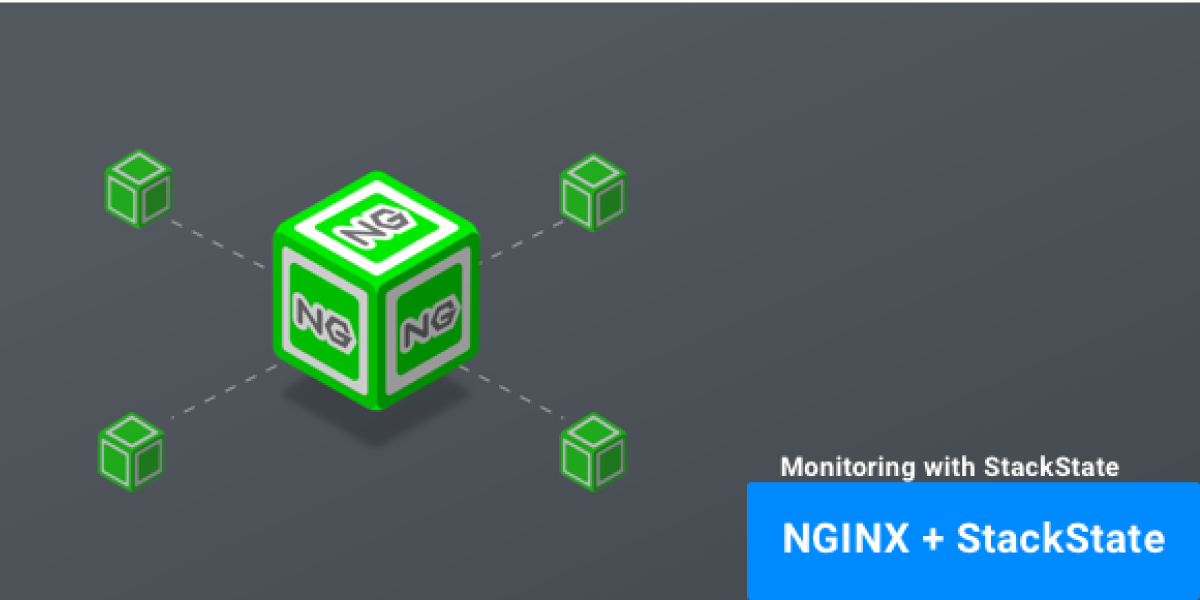
Using NGINX to Solve DevOps Problems
A good example of a tool chosen by DevOps-focused teams is NGINX. It’s used more and more, and by all different kinds of companies. And for a very good reason: It’s a very stable, lightweight web server and reverses proxy that can run in containers. It’s easy to deploy, consumes minimal resources, and – as said before – is very stable. NGINX is easy to configure, especially compared to alternatives like Apache. NGINX Plus also gives great insights into important metrics, like the number of calls per minute and response times.
However, when things go wrong somewhere in the stack, business services can be affected. Developers need to be able to quickly determine the root cause. For example, let’s say the NGINX logfile suddenly reports lots of 500 errors, and NGINX is not the root of the problem. Instead, the business services that depend on NGINX and its underlying infrastructure and applications are likely experiencing an issue, and need to be back to a normal state as soon as possible.
So we need to have insight into the relations between all the components that make up the business service, from process steps down to the hardware racks and everything in-between. We then need to add all available metric streams to the model.
How StackState Helps
StackState Algorithmic IT Operations extends web server monitoring beyond the basic metrics. Based on a single agent, StackState is able to check system processes and auto-detect all running NGINX instances. You can visualize your NGINX web servers and see the full picture of your landscape topology, including its critical dependencies.
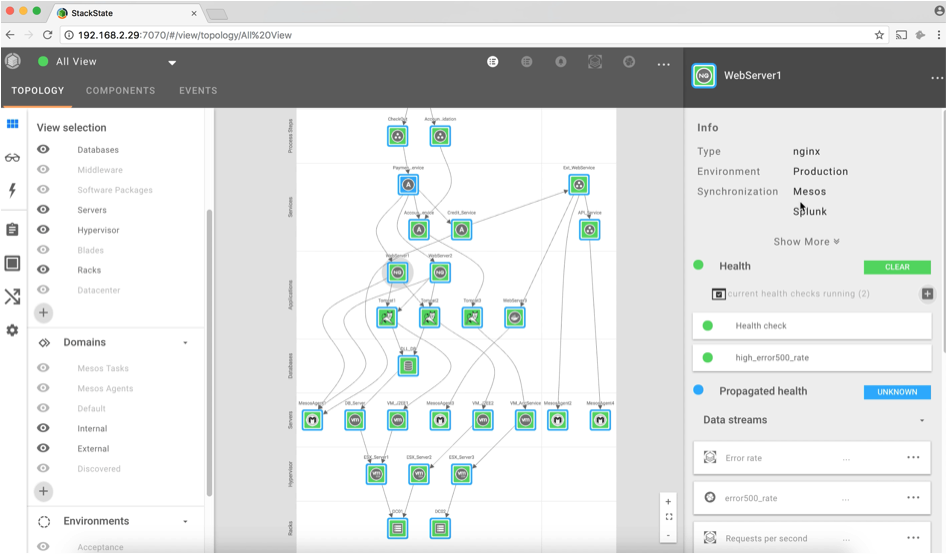
StackState gives visibility into the entire application stack. By combining all available data sources into one single unified overview StackState enables making the right decision in a split second, simply because all components, their relationships, and all available telemetry are processed in the StackState model. This way, the root cause of the problem is automatically discovered, and fixing the problem can be initiated right away.
Investigating a 500 Error Issue with StackState
Each component in StackState represents a health state. The inner color represents its own health state and the outer color represents its propagated state. Components can turn green (clear state), orange (deviating state), red (critical state), and blue (unknown state). This way of visualizing makes it easy to understand which part of the stack is healthy and which part not.
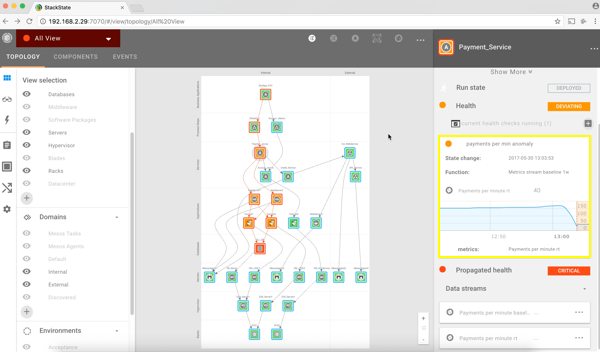
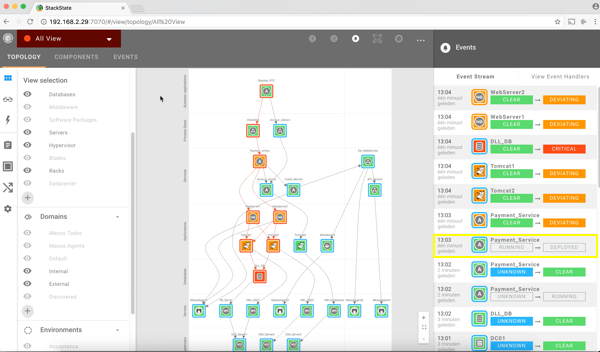
When an issue occurs in your IT stack, StackState will notify you immediately via its user interface and integrated notification tools like Slack. In this case, we receive a notification telling us that the propagated state of the “Business Application” component turned into a red, critical state.
Via the user interface, we notice that multiple components in this view turned into an orange, deviating state and even one component turned into a red, critical state. The “Business Application” component itself seems to be fine (note its green inner color), but we still want to investigate what, where, and how this happened.
We start with investigating the Payment Service component because it’s the component most related to our Business Application and it shows it is in a deviating state. When clicking on the Payment Service component, the right pane in the user interface will open up and automatically show the most relevant metric. We notice that one of the anomaly detection algorithms spotted unusual behavior. That’s why this component is in an orange deviating state.
2. Further down the stack, we also notice that the NGINX web servers got affected by this issue and are both in a deviating state. Investigating the related metrics tells us that we are dealing with HTTP 500 errors and slow response times for some requests.
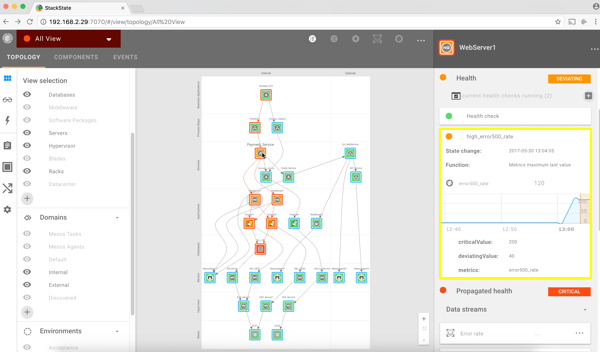
3. Deeper into the stack, we see that the database is in a red, critical state. The database probably caused this issue and is responsible for affecting the Business Application. StackState does not only show the most relevant metrics but is also able to aggregate log information and stream this to the corresponding components. The collected log information for this database tells us that there are full table scans on the ‘pixelpost_pixelpost table’.
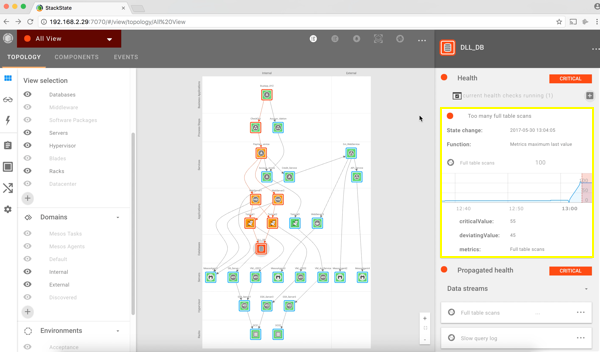
4. Problems in IT stacks can usually be traced back to changes. Having a complete change log of everything in the stack is therefore vital. Everything that happens in StackState is triggered by an event. The event tab in the user interface enables you to see all events that happened over time across the entire stack. Thanks to this functionality we discover that the payment service got a deployment at 1.03 pm which caused the database to do full table scans. A roll forward or roll backward of the deployment should solve the issue.
Some examples of information collected (by collecting and aggregating metrics and log):
Critical request/ response times on the dependencies between the (micro) services, NGINX and other (micro) services
Number of active client connections (NGINX Plus)
Number of accepted connections (NGINX Plus)
Number of keep-alive connections waiting for work
How many times the server became unhealthy (state “unhealthy”)
Number of responses with 5xx status code
For an overview of all metrics available for use with NGINX, see http://docs.stackstate.com/integrations/nginx/
Conclusion
In this post we’ve walked you through monitoring NGINX with StackState, how to investigate and solve an issue, and why it’s key to visualize your entire IT stack, including its dependencies. As mentioned above, with more than 80 integrations with popular DevOps tools and technologies, StackState enables you to monitor NGINX in context with the rest of your IT stack.
Looking for more to read? Go to this page and learn how it works. Want a personalized demo? Request a demo right here.


