
Kubernetes, the container orchestration software open-sourced by Google, is dominating the world of containerized applications by holding the largest market share . There are many reasons: Kubernetes drastically extends the capabilities of software for containerized environments, such as Docker, with high availability, fault tolerance and built-in state management. It also simplifies the management of application deployment, network routing and resource allocation.
However, just moving some applications over from a set of VMs to a Kubernetes cluster will not work effectively on its own without proper preparation and additional configuration, since each newly created cluster doesn’t have a default ‘optimal’ performance setting for each workload running on it. Each Kubernetes cluster implementation has its own difficulties and nuances. Those microservices you moved might perform poorly or even generate errors that might impact the end user’s experience. Less-than-optimal use of the platform can lead to poorly performing services that impact end users and ultimately result in lost revenue.
Troubleshooting slow performing microservices in your Kubernetes cluster
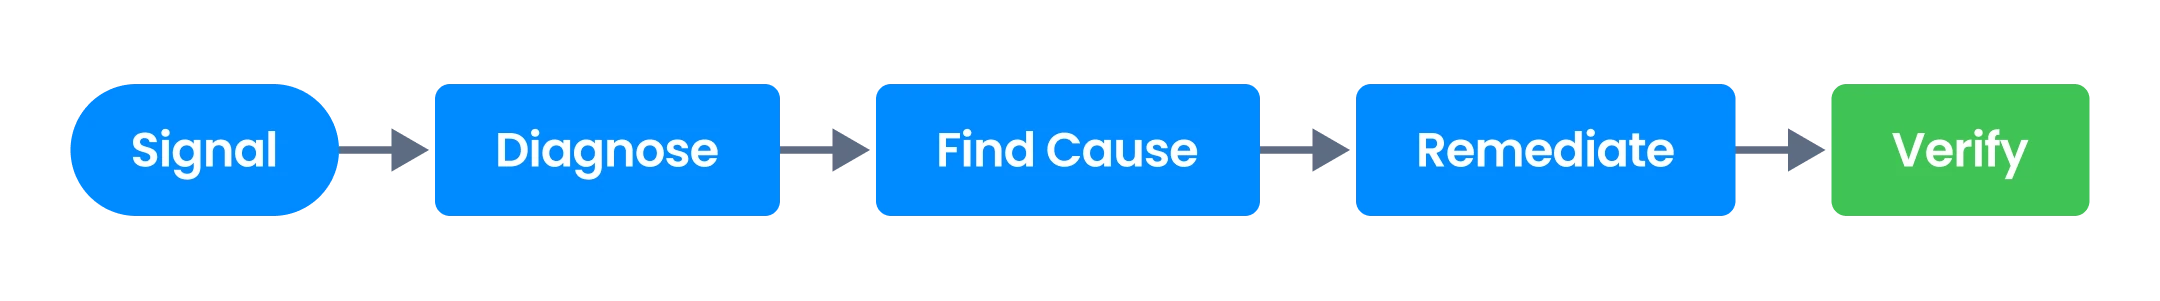
In general, most troubleshooting flows in your Kubernetes cluster will follow the same pattern:
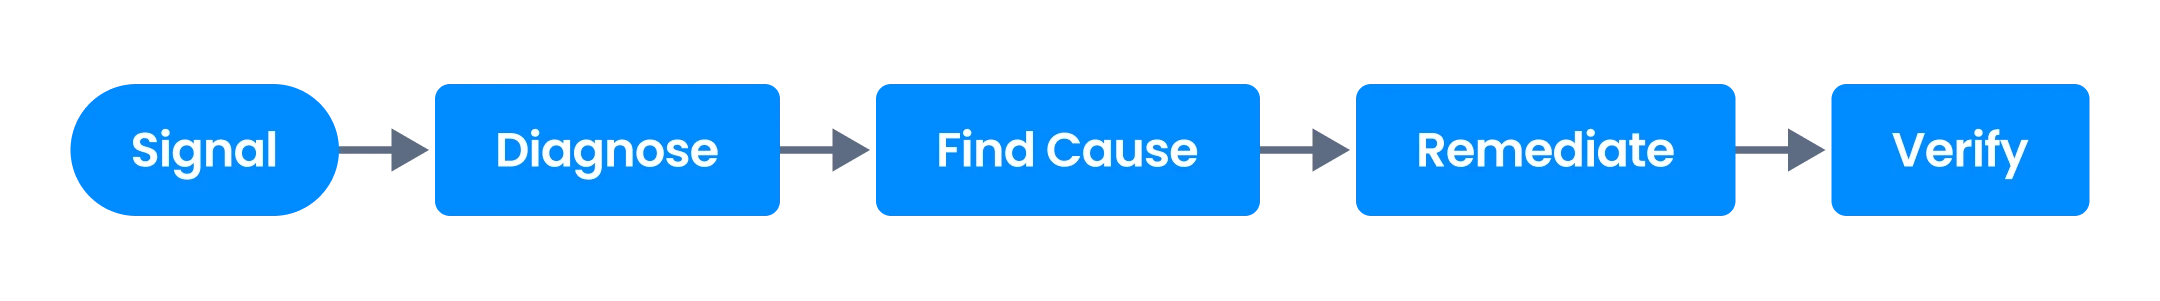
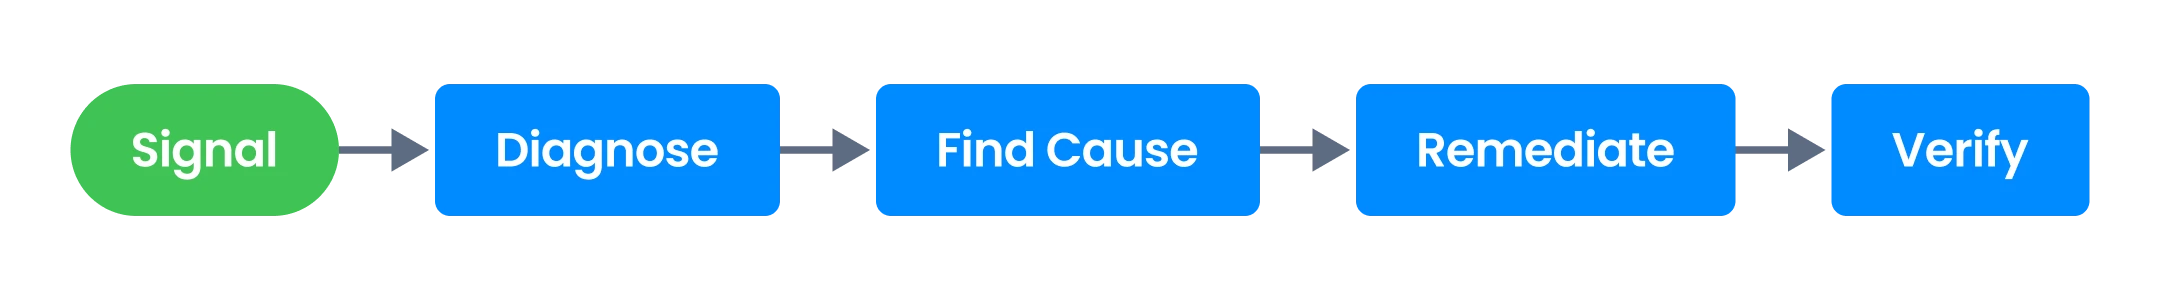
First, you get a signal: It might be an alert from an observability solution, a ticket created by the customer support department or some other kind of notification.
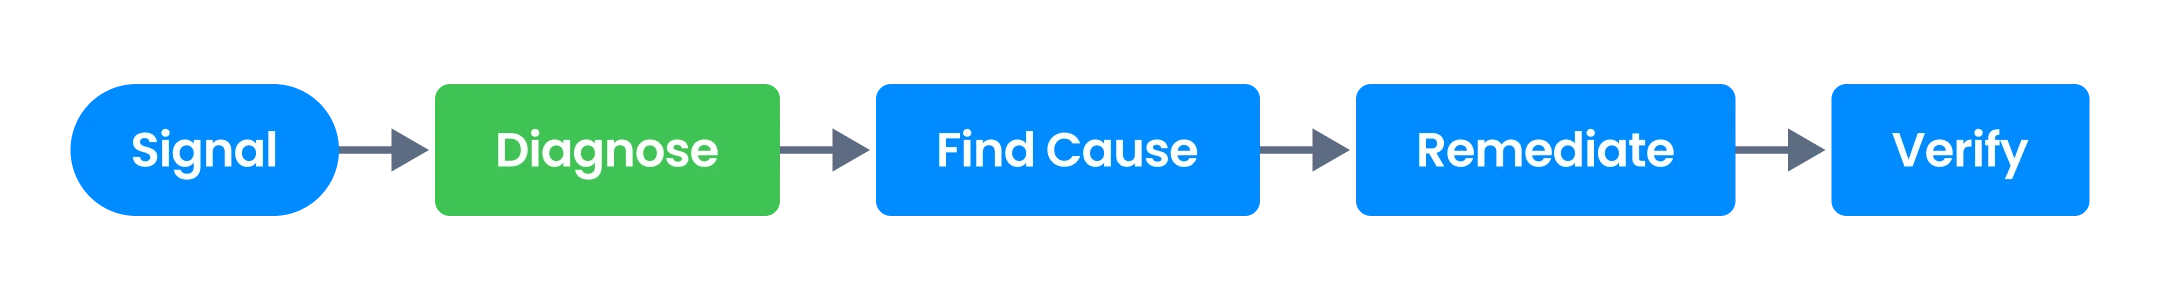
The first step you take is to diagnose the issue and see what effects it has on the system.
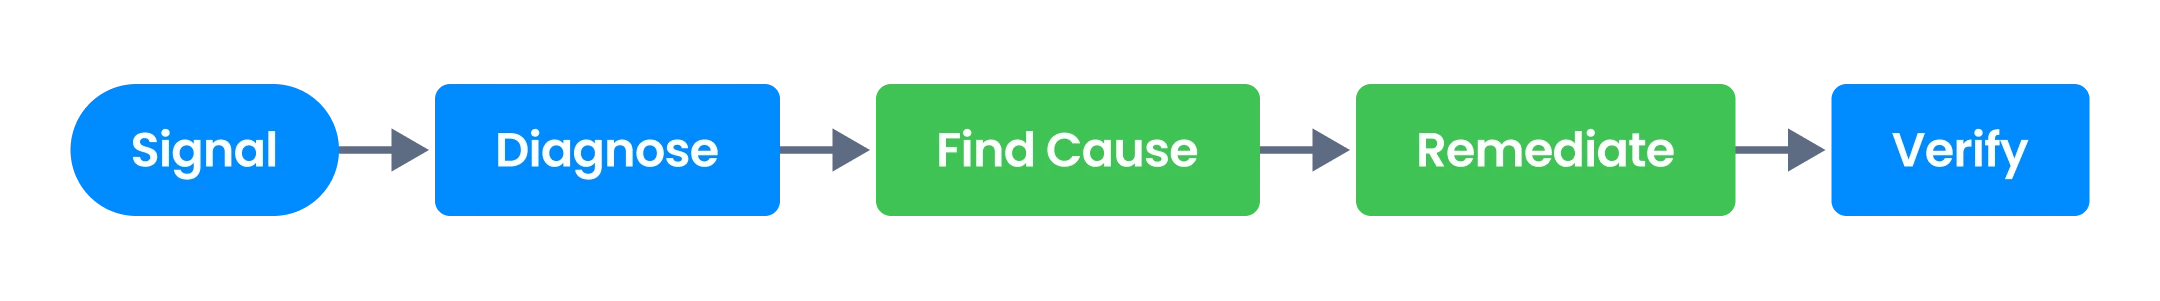
The next step is to find the real cause by ruling out different possible causes.
Then you follow a two-step approach to remediate the problem. First, get the service in a normal state by adding more resources or by bypassing some functionality if possible (also known as using circuit breakers). Second, fix the underlying cause of the issue.
In the last step, verify that everything runs as expected. Add additional monitors if needed to ensure the issue you fixed will not cause a problem again.
Monitoring the golden signals
To understand how to troubleshoot (micro)services running on a Kubernetes cluster, you first need to think about what you need to monitor and optimize.
You can deploy a pod within your Kubernetes cluster and define services to utilize it. The service is the entity you should monitor and optimize, since a pod is something that can come and go and can have multiple instances depending on the load put on the service. If you monitor on a pod level, you are essentially monitoring the job of the orchestrator that already acts on the pod behavior. In most of the cases, it will lead you in the wrong direction.
To monitor services, it also essential to understand how a particular service is part of a full-service chain, e.g., how the different services interact with each other. This is important because services influence each other. Even a slight increase of latency in a lower-level service like a database might add a lot of latency to the end service if it is used a lot.
Because of this, it is important to monitor four specific (golden) signals in a microservice architecture in order to thoroughly understand all the relationships and how the services affect each other within your Kubernetes cluster.
Throughput: the number of requests processed per second.
If you see a certain level where the throughput does not increase, you know that you are at the saturation point of that service. Also a sudden drop in throughput gives you an important signal: it tells you that either the calling service does not call the service anymore or that there is an issue between the calling service (or the end user) and the service where the throughput is measured.Latency: the response time of each process.
In an ideal case, the latency is low and quite constant. If the latency spikes, it can mean that a related service on which that service is dependent is saturated or that there is a bottleneck in the processing of the service itself.Error rate: the number of errors per second.
This should be a constant number (better yet zero) and is related to the throughput. If error rate increases and there is no correlation with increase in throughput, it means that either the service itself has a problem or one of the services it depends on is struggling.Saturation: a measure of how close your service is to operating at full capacity.
This can be measured by putting a lot of traffic on the service and measuring its performance under load before taking it into production. With this information, you know how much throughput can be handled. At the very least, you should measure
the saturation of the resources providing the service, such as persistent volumes, memory and CPU.
Because of the importance of these four signals, they are also referred to as "golden signals."
Diagnose - find the bottleneck service
Slow-performing services in your Kubernetes cluster can be troubleshooted by starting from the highest (business) services in a service chain and working your way back to all the services they depend on. To diagnose a problem, you should look at slow-performing services and their input and output latencies; if input latency and output latency show the same behavior pattern, you should follow that dependency to the point where the input and output latencies are not correlated. [LW2] At that point, you might have found the services causing the issue and then you should look for a likely cause.
Common causes and remediations of service slowness in your Kubernetes cluster
There can be many causes of service slowness. Here is a list of five very common ones:
Database misconfiguration
Excessive algorithmic complexity
Deadlocks or thread starvation
Excessive garbage collection
Database misconfiguration
A good place to start is to look for missing or incorrectly configured indexes for new or changed functionality. By checking the query latency and comparing that with previous query latency, you can see if there are new or changed queries that respond more slowly. If so, you can compare the time period before and after the introduction of those queries to see if there is higher disk I/O and/or more CPU time used. If one of these is the case, adding more resources can be a fast fix. The real long-term solution is to ask the team that created the change to make better use of indexes, which they can do by either optimizing the queries they use or by adding extra indexes to the data schemas to make them faster.
The good thing here is that adding extra resources to a Kubernetes cluster can be done quite easily by changing the configuration.
If no specific queries are found to be slow, it may be that there has been a change in behavior due to external changes, like back-ups conflicting with user load or other database configuration changes.
Excessive algorithmic complexity
Excessive algorithmic complexity can cause poor performance when used on a large dataset in production. Often test sets with a lot fewer items were used during development and testing, so this problem does not show up until the service is running in production.
Here are some effects you might see:
For a certain service, you get a single incoming request, but that service than has a lot more outgoing requests, e.g., for each page you load, you go back to the database (or another service) to get the results for a single row on that page. If you do this with a small sample there is no problem, but if you do this in production and if the database becomes a little slower, the latency becomes huge. For example, if every row adds even 1ms latency then it will take 50ms to load a page with 50 rows. And if a single row takes 10ms latency (which is still fast), it will take 500ms to load the page.
A certain service needs to get too much data from its supporting services or datastores. The bigger the dataset becomes, the more data it needs to scan and the service becomes slower over time. A common solution is to add more indexes or caches.
Deadlocks or thread starvation
Starvation describes a situation where a thread is unable to gain regular access to shared resources and is unable to make progress. This happens when shared resources are made unavailable for long periods by greedy threads. In many cases, this means that software is not well-designed for multi-threaded usage. Optimizing the code is the solution, making sure to use locks in a way where they block only when really needed. A common mistake is to block execution of a big code block when, in reality, only a small part of that code really needs a lock to be thread-safe.
Excessive garbage collection
Garbage collection (GC) is built into programming languages such as C#, Java or Golang to free up memory. When you run services on these platforms, you should not only pay attention to the memory available on a pod level but also on the virtual machine level of the application. If you see a stable amount of free memory after each garbage collection cycle and if each garbage collection cycle is running in about the same time period (e.g., once per minute), you should be fine. However, if the frequency increases over time or the amount of free memory becomes less and less, it can indicate two things:
Not enough memory is allocated to the process, e.g., caches
need to warm and they consume available memory.
The usage pattern of the application has changed (e.g., the marketing department released a new campaign that is very successful).
There is a memory leak in the application.
If you have excessive garbage collection, you will see that your application becomes slower and slower and that more CPU time is used for the same number of requests. If you configured the pod correctly, the liveness probe will also fail at a certain latency threshold and the pod will be restarted automatically. The restart will fix the problem for a while. Depending on the liveness probe, the impact on users may be only a period of slow performance. On the other hand, the pod could use up all its memory again and end up in a CrashLoopBackoff, causing it to be down for longer periods of time and preventing users from completing transactions.
In most cases, the short-term solution during troubleshooting is to increase the memory of the VM (and underlying pod, if needed) and then monitor whether memory usage stabilizes (if it does, you did not initially allocate enough memory). If allocating more memory does not stabilize the situation, you have a memory leak you need to find. In this case, it helps to track down when the excessive garbage collection started and find out which changes have been made to the service around that time.
Verify the solution
After you have remediated the issue, verify that everything runs as expected and make sure the specific cases you encountered are monitored to make sure this issue will not cause a problem in the future.
For bigger issues, it is important to do a post-mortem analysis and write down all the information gathered during analysis of the issue, so you can learn from the problem and avoid it in the future.
Summary
Troubleshooting microservices in a Kubernetes cluster can be cumbersome, especially in a dynamic declarative environment like Kubernetes, not only because you need to have visibility on a service level, but also because you need to know how every service interacts with other services.
The most effective way to troubleshoot in these environments is to start by focusing on service-to-service dependencies and from there find your way back to the service having an issue. Then relate that to the configuration (or other) change that caused the issue. Once you know the cause, you can remediate the issue, which may involve both short-term workarounds and longer-term fixes. Once everything seems right, verify the solution and ensure the proper monitors are set up to make sure it doesn’t happen again.
Smart troubleshooting with StackState
StackState is a full-stack observability solution that is purpose-built for fast and reliable troubleshooting of complex microservice applications running in your Kubernetes cluster. It automatically discovers the runtime behavior and interactions of all your services running on a cluster (both service and infrastructure maps). It discovers the services and the pods supporting them, including their configuration and run-time behavior. StackState lets you access log files to see any suspicious behavior. It also automatically discovers all changes in your environment that may be the cause of an issue and links you back to the team(s) initiating them. Finally, StackState keeps an extensive history of all your metrics, logs, traces and Kubernetes events in one location where you can access them any time; no need to worry if the data will be available when you need it.
Try StackState for free. See for yourself how easy it is to troubleshoot Kubernetes clusters: Play in our playground .


