This series of six blogs outlines the basics of the Observability Maturity Model. Use it to identify where you are on the observability path, understand the road ahead and provide guidance to help you find your way.
Go back to or skip to: Part 1 / Part 2 / Part 4 / Part 5 / Part 6
Level 2 Overview
Why is the system not working?
An organization at Level 2 in the Observability Maturity Model has built on the foundation of their monitoring capabilities and taken the first steps into observability. In recent years, two major trends have driven the need for the deeper insights that observability can provide:
IT environments are more complex and dynamic than ever. For example, in Kubernetes, a container may only exist for a few hours. Change is inevitable and ongoing; when changes occur, things tend to break.
Customers are getting more and more accustomed to IT products that work flawlessly most of the time, if not all of the time. Uptime requirements for mission-critical business applications are continuously increasing.
To keep your systems running reliably, you need to know not only, “What’s working?” (monitoring), but you also need to understand, “Why is it not working?” (observability).
Monitoring vs Observability:
Is my system working vs. why is it not working?
– CNCF TAG Observability Update, October 2022
While traditional monitoring tracks the health of a system, observability is about getting deeper insights into the behavior of a system over time. Observability naturally evolved from monitoring as reliability demands grew. When something goes wrong and a team receives an alert, they need to quickly figure out, “What happened? Where, when, why and who do we call?” Observability helps you answer these questions. At full maturity (Level 4 in this model), observability provides all the data you need, in the proper context, to automatically detect and remediate issues, and even to proactively identify and prevent them.
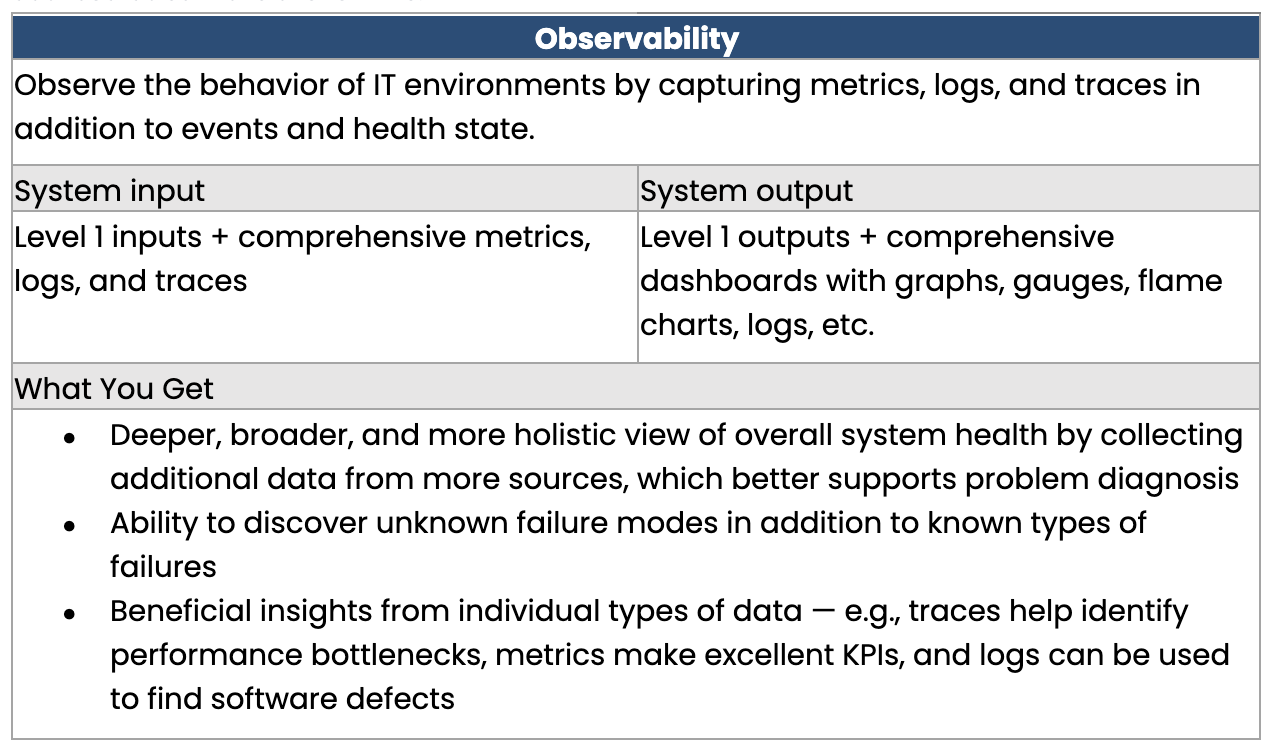
In order to figure out what happened when an alert pops up, you need deep insights into the state of your system. At Level 2, observability typically delivers these insights by focusing on three critical types of telemetry data: metrics, logs and traces.[1] These three pillars of observability are collected from IT components such as microservices, applications and databases to provide an overall perspective on the behavior of a system:
Metrics are numerical measurements that help you understand the performance and status of your services. Examples are the famous four golden signals: latency, traffic, error rate and saturation.[2]
Logs are time-stamped records of relevant events that happen in a system, such as transactions, warnings and errors. Logs help you understand what a system was doing at a given point in time.
Traces are detailed snapshots of how data flows through an application, showing how a request travels from one end to the other. Traces help you troubleshoot performance and sometimes give code-level visibility into how your application is performing.
Logs, metrics and traces, along with events and alerts, are typically plotted on dashboards so teams can easily keep track of important activities. Some observability tools provide out-of-the box dashboards that bring these different types of data together on one screen and allow you to deep-dive into them for further investigation.
Level 2 data has much greater breadth and depth than Level 1, and Level 2 often includes some consolidation of data from across your environment into a single view. You may need to build additional dashboards if you want more insights, especially if your environment spans multiple domains and you are using multiple monitoring tools. Dashboards can be either auto-generated based on dashboard templates or manually created by site reliability engineers and DevOps teams. Creating meaningful dashboards can take a lot of time.
For Consideration: Level 2 Shortcomings
When organizations implement observability, a huge amount of data is usually generated. The good news is teams now have much more information available to help them figure out what went wrong and why. But managing large amounts of data brings challenges:
In the early stages of observability, a lot of data may be collected in data lakes, but due to volume it is often unusable. In a data lake, the data is often not correlated, forcing engineers to manually dig through metrics, logs and traces to get to actionable information.
Compounding the problem, most companies make use of multiple observability solutions, all with their own dashboards, unique capabilities and data silos. Problems that span domains and teams can be very hard to locate and solve.
Observability silos often appear in four main areas:
Silos based on data type (metrics in one area, traces in another)
Silos based on observability tools
Silos based on domains
Siloes based on teams
With Level 2 Observability, even though teams now have a lot of data, they still don’t have the cross- domain, dynamic insights they need to keep their overall systems stable and healthy. When something goes wrong, too many people get involved because nobody knows where the problem is, resulting in “incident ping-pong” and blame games.
At Level 2, you can infer suspected reasons for incidents by manually correlating data, but you may need to build ad hoc solutions to query multiple observability silos to troubleshoot a single issue. Creating these queries requires practitioners with development skills, knowledge of data structures, and understanding of system architecture. In addition, the telemetry-centric and siloed views typical in Level 2 often require substantial manual work to extract actionable insights. Setting up efficient dashboards can take considerable time and they require ongoing maintenance.
Root cause analysis, impact analysis and alert noise reduction are important in maintaining a reliable and resilient stack, but these activities are challenging at this level. Without an automated way to unify and correlate the siloed data from various tools and domains, it is labor intensive and time consuming to pinpoint the correct root cause of an issue and solve the right problem. Consequently, MTTD and MTTR are higher than they should be, more customers are affected and revenue is lost.
Next Step: Causal Observability
In order move to Level 3 and understand how your observability data is related, you need to provide context for events, logs, metrics and traces across the data silos in your IT environment. At Level 3, Causal Observability, you get a precise map of the topology of your business processes, applications and infrastructure and you can track how it all changes over time. When something goes wrong, you can use this contextual data combined with automation to quickly determine the cause of an issue without having to manually wade through silos of uncorrelated data.
References
[1] Distributed Systems Observability: A Guide to Building Robust Systems: A Guide to Building Robust Systems , by Cindy Sridarhan, O’Reilly Media, 2018.
[2] Site Reliability Engineering: How Google Runs Production Systems , edited by Betsy Beyer, Chris Jones, Jennifer Petoff and Niall Richard Murphy, O’Reilly Media, 2016.


