Neural networks don't need human help
First, I will talk about big data and deep neural networks. Deep neural networks are machine learning models that have gained popularity in recent years because they could solve problems that were not possible to solve before: they dramatically increased the accuracy of image recognition, speech recognition, machine translation and virtually any task for which there is enough data to train the neural network. What makes them so powerful? One of the answers is that they do not depend on domain knowledge and can discover predictive patterns without human supervision. Traditional algorithms would rely on hand crafted representations of images, speech fragments or text and use it to learn a predictive model – if something was missing in it, then the algorithm failed. People invested heavily in making such representations for different tasks, but it turned out to be too difficult – in essence a human would need to understand how to solve a task and then pass on this knowledge to an algorithm. Neural networks can do it themselves – they do not need human help. However, they need a lot data.
Diversity of data is key for neural networks
Neural networks need a lot of data. The more data there is, the merrier. More data means that one can train a deeper neural network, and deeper networks can capture more complex patterns and make more accurate predictions. However, the story is slightly more complex – neural networks benefit from bigger datasets not because they are bigger, but because they are richer. Big datasets are richer than small ones in many aspects: they have examples of rare events, they have examples with similar events in different contexts, they have examples of different factors coming into play in different combinations, they give a richer worldview and neural networks can exploit it. Just duplicating a dataset does not make it richer, it is the diversity of the phenomena in the dataset that makes it rich.
Diversity of data drives the performance of the algorithms. Seeing the same face will not teach you to recognize faces and reading the same text all over will not make you smarter – this is not surprising. Collecting more diverse data will pay off more than just collecting more data – there is little value of seeing the same thing twice. However, that is just one dimension of diversity. In order to collect truly diverse data, one needs diverse data sources – multimodality.
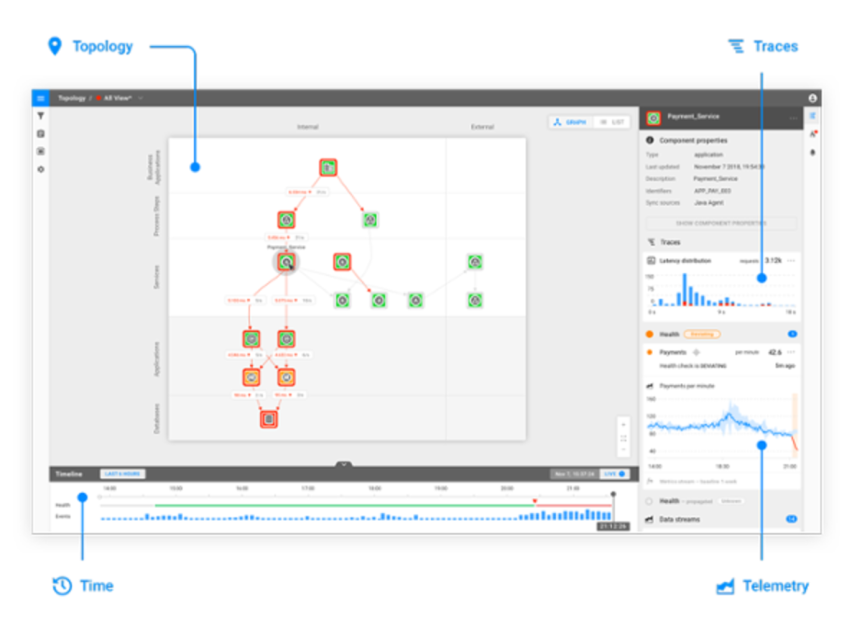
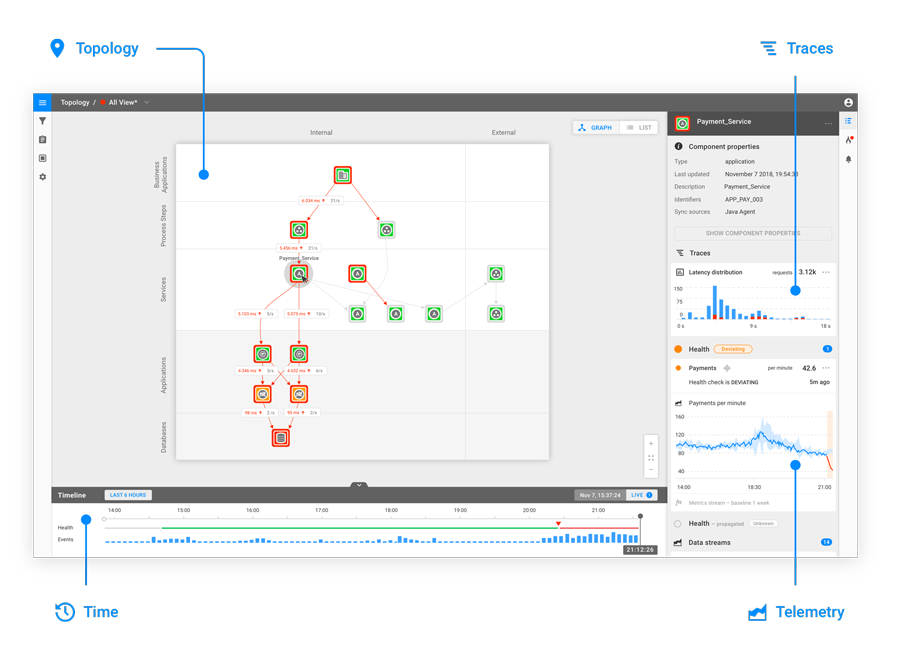
The four important dimensions in AIOps
Multimodality has been exploited by AI since before Deep Neural Network. Perhaps the biggest success story is Google Search – it is truly multimodal when it comes to ranking webpages. Google uses many modalities: how similar is the webpage to users request? How popular is the webpage in general? Does it have good text and pictures? All these factors contribute to the ranking shown to the user. Considering just one factor in isolation is not enough to satisfy the user. Similar situations can be observed through machine learning landscape – modest gains are achieved by squeezing everything out of a single data source and big gains are achieved by adding new modalities and considering more factors. There are examples across many domains: adding images to text to make machines chat better, looking at lips while listening for speech comprehension, putting gyroscope and accelerometer data together for human activity classification – the examples are endless.
What are the modalities of AIOps and can one deliver value while just focusing on one of them? There are at four important modalities in the AIOps space: topology, telemetry and traces all changing with time. I would argue that it is very hard to manage the IT space without being aware of all of them. For instance, imagine a sudden change in one of the telemetry streams – is it possible to reason about it and its impact and significance without being aware of topology, traces or time? The answer is, of course, no.
In order to successfully deliver value in the AIOps space one must reason about changes to the components that result in changes in the telemetry – for example memory leaks, changes in the components that result in a changing topology – for example changes in routing, changes in the traces that result in changes topology – for example changes in the API's and all other combinations. Focusing on one modality is like taking things out of context – they stop making sense.
Combining topology, telemetry, traces and time in one AIOps platform
StackState is built around the 4T data model: topology, telemetry, traces and time. At the heart of StackState's AIOps platform is the Versioned Graph Data Base – a proprietary database technology that lets StackState ingest and process vast volumes of data coming from the IT infrastructure and do reasoning with it. This technology is unique – solutions available on the market do not accommodate for changing topology, something which is constantly happening in IT infrastructures. StackState Versioned Graph database tracks the changes in the topology by saving small increments each time the topology changes – this way StackState can travel back in time and see what the IT infrastructure looked like at a particular time frame and correlate changes in topology with other events, such as updates to software components, changes in telemetry and most importantly IT infrastructure outages.
The versioned graph database enables StackState to deploy a rich variety of algorithms that require access to topology and its changes, telemetry of components making up the infrastructure, traces and time. Without it StackState would be severely limited – it is hard to draw insights while being restricted to only one source of information without the necessary context. Currently the 4T Data Model enables automatic root cause analysis, problem clustering and anomaly detection. These technologies would not have been possible without the 4T Data Model. It allows algorithms to have a holistic view of the IT infrastructure and put individual observations into richer context.
The next step: predicting the future
The 4T Data Model also enables the future vision of StackState: Automatic Pre-Mortem Analyses (APMA). The goal of APMA is to alert the system operators before a problem occurs, so that it can be fixed before impacting the business. APMA has all the properties and requirements of ARCA: it needs topology to reason about impact, time to reason about causes and telemetry to understand what is happening. Contrary to ARCA, APMA needs to be able to reason about future – this brings additional challenges. Two of them are of particular interest:
prediction and;
prediction at scale
Prediction of the future is a hard task. APMA relies on being able to predict future health states of components. At first glance it is a telemetry prediction problem, however it requires all the "T"'s. One can try to predict the future telemetry values based on its past values; however, few interesting predictions can be made this way – it is hard to achieve anything beyond simple extrapolation. However, when one puts the time series into rich contexts, they start to make much more sense. For example, observing a change in topology can be a very useful signal to predict a change in telemetry – for example removing a gateway can lead to another gateway being overloaded – something impossible to predict just by looking at the number of connections at one of the gateways. Putting all the "T"'s together not only improves the prediction accuracy; it can make an "unpredictable" event "predictable".
Prediction at scale is even more challenging. Given a predictive model, where do we apply it? Do we apply it at the entire IT landscape? This is unfortunately impossible for any landscape bigger than a toy example. Predictions are expensive, so one must decide where the predictive spotlight should shine. This is exactly what StackState Spotlight does – it monitors the IT infrastructure and decides which part of it requires the most attention at each time step. It uses complex heuristics: which components changed? Are there any new interesting traces? Are there any new connection in the topology? Did I shine here recently? StackState Spotlight makes it possible to monitor a big infrastructure in a smart way without wasting precious computation resources while providing maximum coverage of the IT landscape.
Realizing the full potential of AIOps with StackState
IT infrastructures are complex systems – looking at them through a single lens is very limiting. In order to bring value in the AIOps space one must take into account topology, telemetry, traces and time. Each of these signals is hard to interpret without the context; that is why it is so important to bring them all together. Only then one can realize the full potential of AIOps.
StackState's AIOps platform is built to realize the full potential of AIOps. Its data-agnostic approach combines and analyses metrics, logs, events, traces and data beyond typical monitoring data, like Google Analytics, CMDBs, CI/CD tools, service registries, automation and incident management tools.
StackState uses the variety of data it collects to learn about dependencies, allowing it to build a topology of dynamic IT landscapes in real time. By ‘rewinding’ the topology visualization in time, StackState instantly assist teams in discovering the root cause of incidents and how the impact of these incidents have propagated across on-premise, cloud and hybrid IT landscapes.
Are you looking to learn more about AIOps? Here are some great resources to get started:


