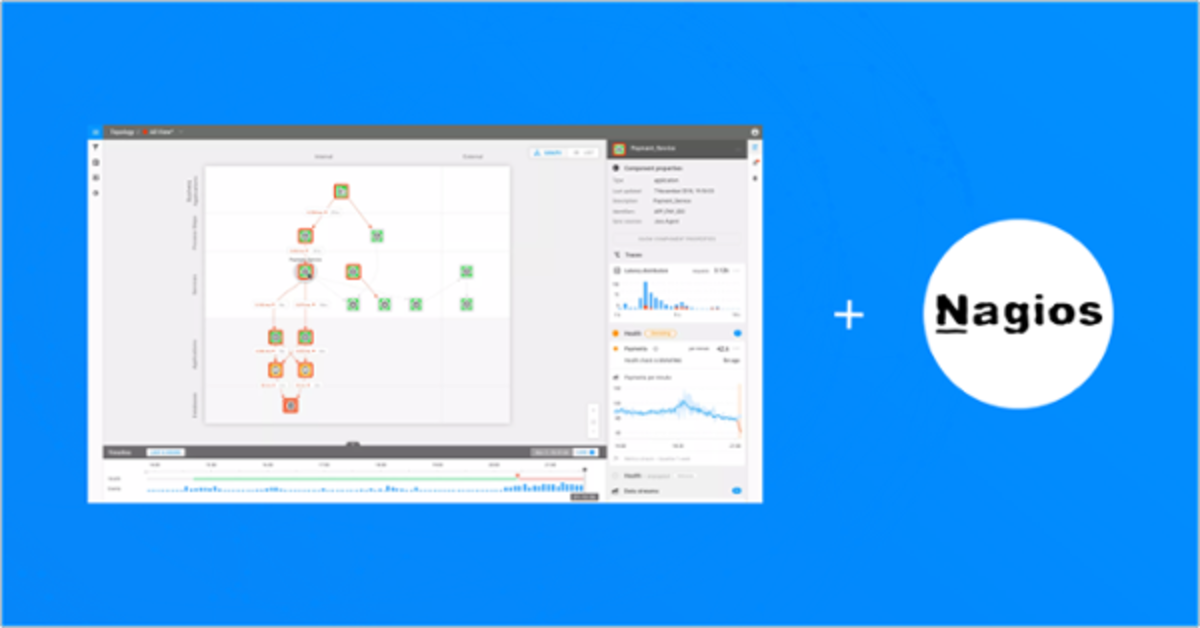

StackState’s Next-Gen Monitoring and AIOps platform utilizes your current IT investments (like Nagios), by combining and analyzing metrics, logs, events and data beyond typical monitoring data, like Google Analytics, CMDBs, CI/CD tools, service registries, automation and incident management tools. StackState uses the variety of data it collects to learn about dependencies, allowing it to build a topology of dynamic IT landscapes in real-time.
What is Nagios?
Nagios is an open source monitoring system for computer systems. It was designed to run on the Linux operating system and can monitor devices running Linux, Windows and Unix operating systems. Nagios software runs periodic checks on critical parameters of application, network and server resources. It offers monitoring and alerting services for servers, switches, applications and services.
Troubleshoot issues fast and get your service back up in no time
StackState sends Nagios alerts as events to its AIOps platform, where it is combined with real-time topology and telemetry information from other sources. Combining StackState with Nagios leads to the following benefits:
Real-time visibility, zero blindspots.
IT teams are using multiple monitoring tools to monitor different layers of the IT landscape. The data-agnostic approach of StackState allows you to connect data from Nagios with other tools. In this way, you consolidate insights that were previously locked in siloed domains. The result? Visibility into components and dependencies across teams, tools and domains with zero blindspots.
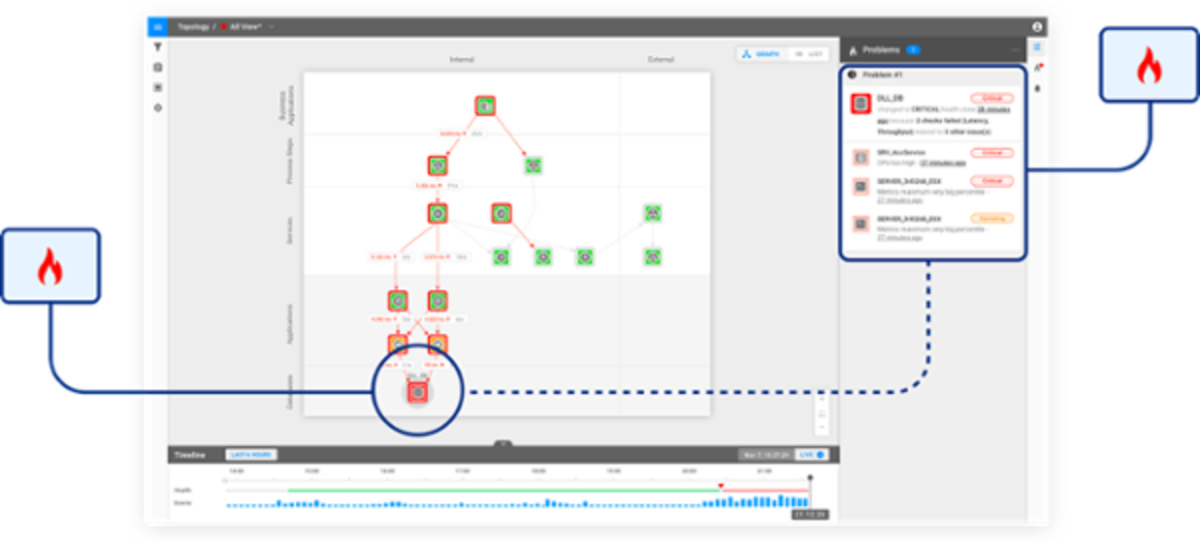
Reduce the noise. Aggregate and correlate Nagios alerts into a single place and understand which alerts matters the most. StackState identifies issues that are likely to related in cause and clusters them together, so you aren’t deluged with cascades of individual alerts.
Efficient and quick troubleshooting.
Rewind StackState's topology visualization in time to immediately pinpoint the root cause of incidents across your cloud and/or on-premise environment. StackState's unique versioned graph database enables our users to save each Nagios event as a snapshot and watch in detail how components in your environment were affected over time .
StackState's data-agnostic approach makes it possible to integrate with each and every technology or tool. If you would like to learn more about StackState and how it supports your specific technology stack, feel free to request a guided tour right here . We are more than happy to walk you through the product.


