Visualizing Your Environment
The key behind StackState's ability to help you keep your environment stable is to first build a map of your environment. Integrating and consolidating data from different sources such as CMDBs, real-time service registries, process and port listings all provide parts of the puzzle. StackState analyses and merges this information into a coherent whole.
The key behind StackState's ability to help you keep your environment stable is to first build a map of your environment.
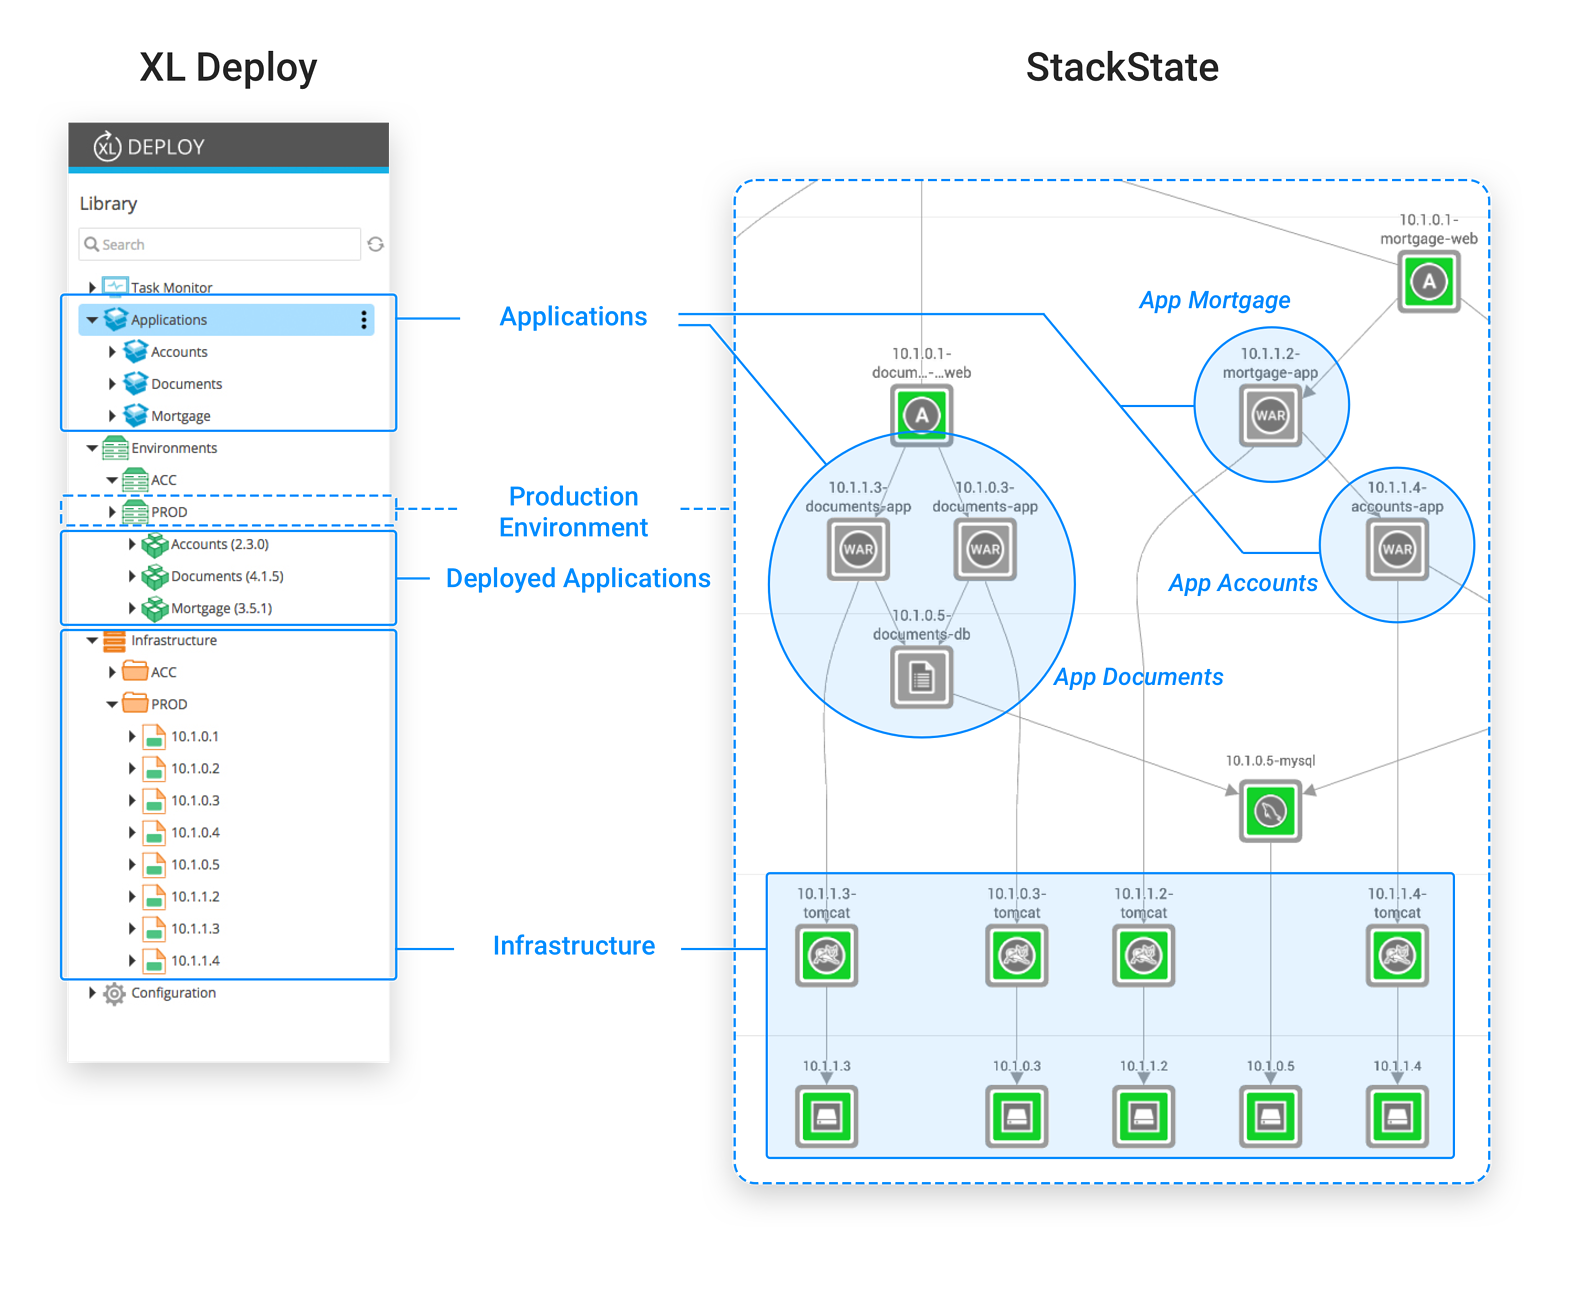
XL Deploy, with it's knowledge of servers, infrastructure and applications is an ideal data source for StackState. Using the out-of-the-box StackState XL Deploy plugin, StackState instantly produces a picture of your landscape. Here is an example XL Deploy setup that contains a few applications, deployment packages and two environments. StackState's integration with XL Deploy is able to visualize this landscape:
Application Dependencies
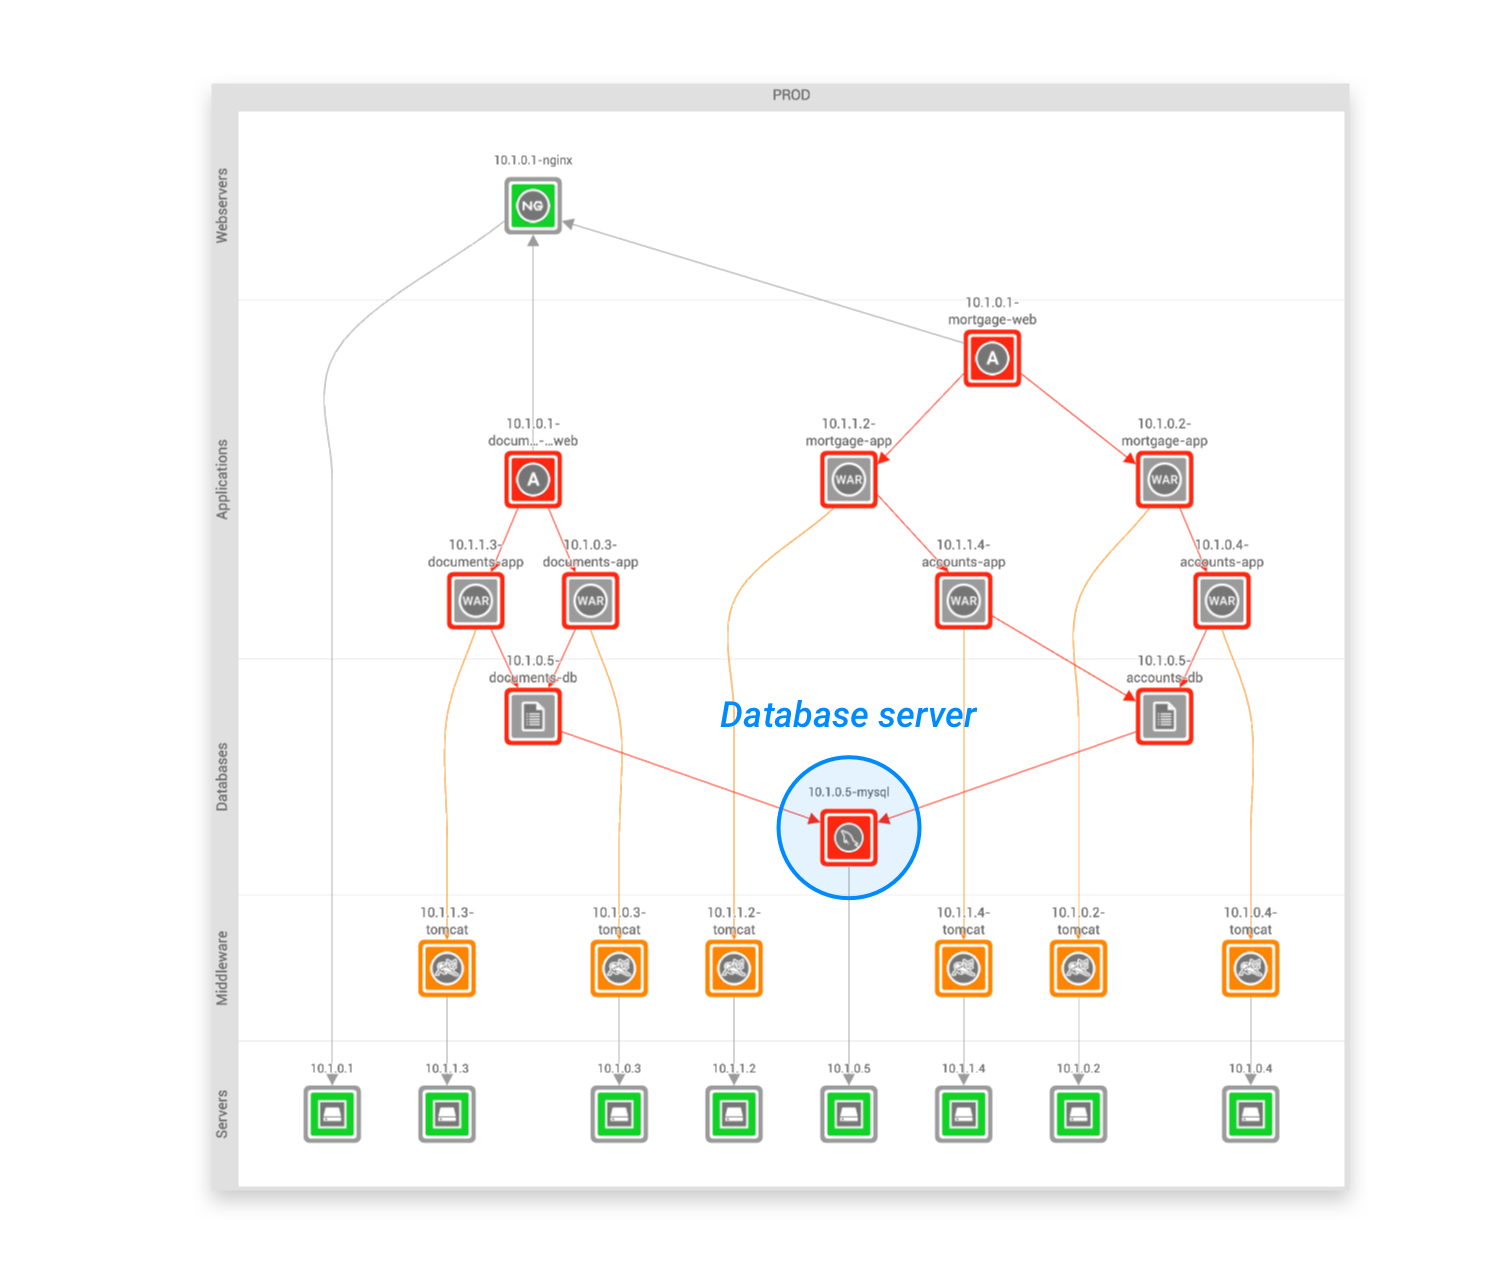
StackState extracts relations between servers, middleware and applications from XL Deploy. On top of that, StackState automatically detects runtime interaction between these components. StackState's runtime agent, installed on the target servers, deduces these relations based on actual, observed communication patterns. This means the information is always up-to-date and accurate and requires no manual configuration. Related components represent dependencies from one component on another component. If there is a dependency between the Mortgage application and the Accounts application, this means Mortgage needs Accounts to do it's job. If there is any slowdown or failure in Accounts, you can expect Mortgage to experience a slowdown or, worse, fail. Similarly, any irregular patterns detected in Accounts could signal a risk for Mortgage as well. Dependencies go even deeper than that. See the database server? It is a dependency of both Accounts and Documents. Any issues with the database will impact both services even though there is no direct relation between them. And remember, any impact to Accounts impacts Mortgage too. Imagine a landscape comprised of applications that all depend on each other, for instance in a microservices architecture. A slowdown or failure anywhere in the landscape will cause any number of dependent applications to fail. This situation is almost impossible to diagnose unless you know the dependencies between the components. This topology is one of StackState's most fundamental features.
Metrics
Armed with the topology view, we can now start looking at the runtime behavior of the stack. StackState comes with plugins that track metrics for lots of different middleware. Disk space, response times, queue depth, you name it. Here is an example of what StackState tracks for the Tomcat application server:
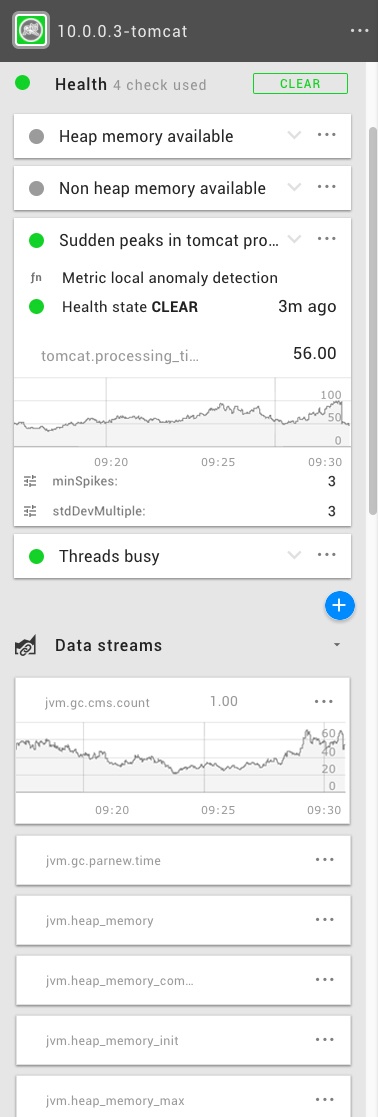
These metrics represent the activity of the component. StackState tracks this data and stores it for a configurable period of time. StackState can also interpret these metrics and determine the health of the component by defining health checks. For instance, StackState can detect anomalies in your metric stream and alert your team when observed values differ significantly from the baseline. If a health state changes from clear to deviating or critical, StackState displays this in the topology view to indicate which services are at risk.
Here you can see the relations at work. Even a team working on a microservice that has no interaction with the particular host can be made aware that there is a potential problem and knows where in the stack the problem originates. This saves countless hours in debugging and troubleshooting.
Tracking Deployments
One of the data points StackState tracks for your components is a version. This is an identifier representing which version of the component (for instance, the application) is currently running. Whenever XL Deploy performs a deployment, StackState updates the version of the components involved. Version changes translate to a deployment event that StackState registers and displays to the user, along with any other changes in the environment that it detects:
The event stream is a complete change history of any component in your view and is an invaluable tool in root cause analysis.
Time Travel
By default, StackState always displays the current situation, making the teams aware of what is happening now but it also has a great memory. StackState keeps a record of all changes to your entire IT landscape and allows you to travel back in time at will. This makes it possible to analyse failures and do interactive post-mortems, tracing back through all changes impacting your landscape. This picture shows the time travel functionality in action:
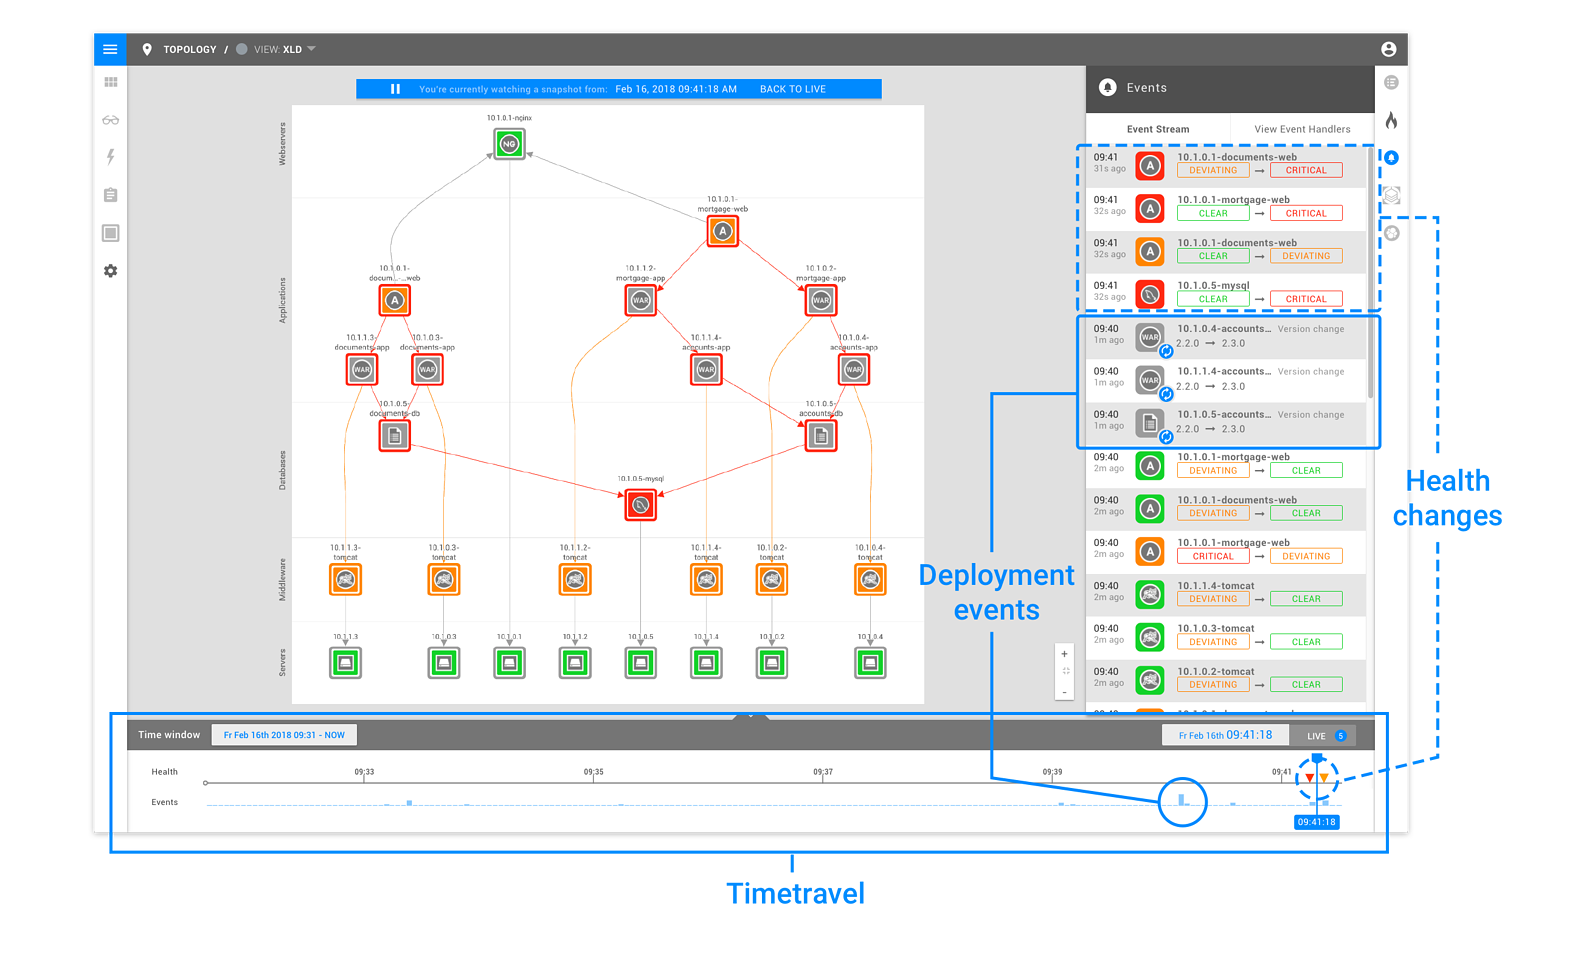
As you can see, the timeline below the topology view shows you what time the current view was taken and includes a record of the events and health changes that occurred at a specific moment in time. Clicking anywhere on the timeline allows you to travel to that point in time, displaying the events and metrics from the past.
Wrapping Up
Continuous Delivery can really put your teams to the test. Fast, short release cycles and continuous updates make it hard to keep track of your application landscape. DevOps teams need to understand how their applications are interrelated and how they are performing.
StackState delivers this insight, real-time, always up-to-date and without manual configuration. With the new XL Deploy integration, StackState combines XL Deploy data with information from other sources to create a digital map of your application landscape. As your applications are updated, StackState tracks XL Deploy deployments and, indeed, any changes over time to reduce the time it takes to diagnose and repair outages. Want to see for yourself? Try out StackState here.


