The StackState real time model
StackState is designed to manage complex IT stacks with millions of constantly changing components to handle today’s complex environments. In modern enterprises DevOps practices, micro services architectures and containers are common. The StackState platform is designed to handle millions of concurrent data streams, which are automatically correlated with the corresponding components and business services.
Understand your topology/data
Before Agile and DevOps IT Blueprints were created as often as the business pace dictated. A few times per year. Nowadays new systems are created and changed constantly. In order to cope with these changes there is a need to automate the process of creating IT blueprints. A StackState we believe the model should be dynamic. And real time.
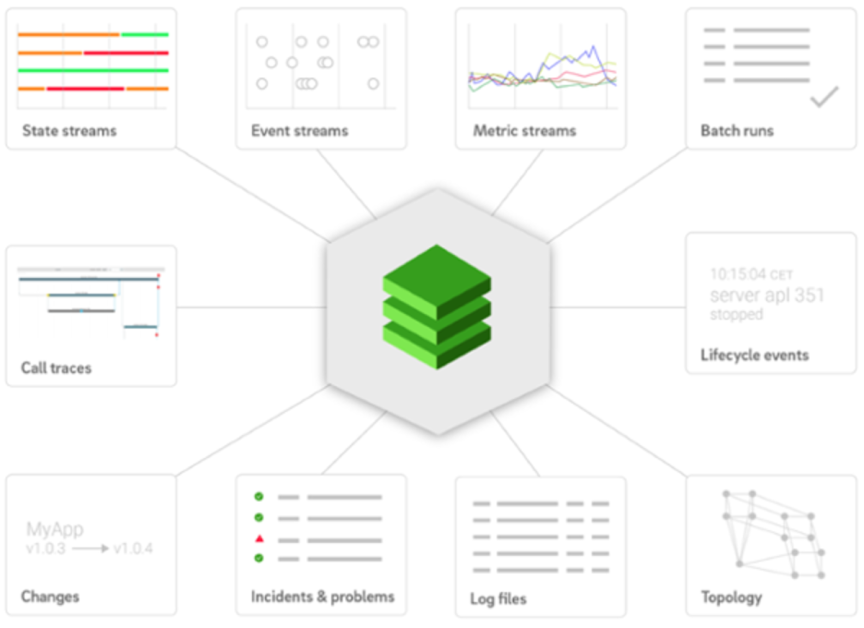
We created such a model. The StackState model consists of the following information:
Topology (components and their dependencies/relations)
Telemetry (real time streams of metrics, events and logs)
Changes (deployments, life cycle events, software updates)
Incidents and problems
Call traces
Batch Jobs
Alerts
We made this model in such a way that it can be easily integrated into your environment. How did we do that?
A component (or a relation) in the topology is defined by:
- Its description (Nginx load balancer nginx-0023)
- Tags (type: load_balancer, version: 1.10.1)
- Streams (log streams, event ~, state ~, metric ~)
- Dependencies
- Their relation to the StackState knowledge base
The StackState model is synchronized from different sources and has the power to automatically identify similar components coming from different topologies. StackState derives topology information from:
Provisioning tools (e.g. Chef, Puppet, XL Deploy)
Discovery tools (e.g. Evolven, HP uCMDB)
The StackState Agent
Tracing tools (e.g. Zipkin)
Microservice management tools (e.g. Kubernetes)
Batch scheduling systems
In this way, we empower users to bring all their real time topology data into one place and make it easy to understand what is happening in the stack. All these topologies together form the StackState real time model. StackState determines the identity of individual components and over different components.
Current monitoring tools are not able to keep the same pace as the constantly changing IT stack. At StackState we don’t believe there is one solution to monitor and manage all IT systems. Different teams and stacks have different needs. This is why there is a need for a tool that ties them all together.
StackState is able to monitor systems with its own agent, but is also able to synchronize available data from all your existing monitoring and IT management tools.
Anomaly detection
In the past most IT systems where managed with checks which had hard boundaries for different states (e.g. cpu load > 90% for 5 minutes >> WARNING). These types of checks are not always sufficient. To solve this you can use anomaly detection. Since every component has different semantics you can not use the same anomaly detection model for all different kinds of component types. StackState is able to handle lots of different anomaly detection models and has a large variety of community-shared checks on top of them.
With the StackState real time model we are able to automatically show where problems originate. A few examples, which can cause an outage:
Changes, like middleware or system upgrades
High load spikes
Batch jobs which did not complete in time and cause other jobs to fail
Wrong balance data between services
From insights to remediation
The StackState real time model captures all domain knowledge that operators have built up through experience. Our goal is to use this knowledge combined with all real time data coming from agents, sensors and IT management tools to:
1. Gain insight
- Know which processes are running on which containers.
- Know which metrics and events matter most for those processes.
- Know how different processes are communicating with each other. Also known as application and service topologies.
- Be able to correlate business processes to actual parts of the IT stack.
- Have a real time architecture blueprint at your fingertips.
2. Trouble shoot faster
- Automated Root Cause Analysis by using multiple baselining and anomaly detection algorithms, which are specific for certain component types.
- Automatically show the most likely root cause of problems, which are learned by knowing common failure paths between services.
- We save all data as point in time changes, this gives us the ability to show the state of the stack at any point in time including the moment just before a problem escalated.
- Be able to automatically see all changes, metrics, events, log files, incidents and anomalies that are related to the StackState real time model (real time blueprint)
- See if nodes in a cluster misbehave
3. Prevent problems
- Receive alerts before there is a failure
- Knowing all dependencies between components gives us the ability to find weak spots in your stack
4. Automatically solve problems
- Automatically act on potential problems before they get out of control. (e.g. scaling up resources, rerouting services)
- Automated rollback of changes
Disruption of IT environments
The last 3 years has seen a significant change in service, infra and application architectures. This change is driven by micro services, containerization, continuous delivery, DevOps and IoT. All those changes are meant to make the stack more resilient, better scalable and agile. We see that different teams are using different tools to do their job. We also see that new patterns are weaved with old style architectures. This gives a high increase in changes and complexity while the expectation levels of customers are continuously growing. The task to maintain a constantly changing IT stack and act swiftly when problems occur is a daunting one. Especially with the current tool set. Hence the need for a new approach to monitor and manage complex IT environments.
Today’s applications consist of several distributed components like Kafka, Spark, Elasticsearch, HBase, Hadoop and Cassandra. All of those components themselves are highly distributed systems.
Adding a multitude of distributed systems in the mix to create a microservice architecture which is extreme scalable and agile is difficult to monitor. Learning their behavior and adding relevant metrics to relevant dashboards can take months. StackState gives the ability to automatically apply metrics, checks and anomaly detection models to the right components. StackState has knowledge of all dependencies and failure paths and uses this knowledge to automatically troubleshoot when needed.
Excited to learn more about StackState? Request access and we will give you a proper introduction to our solution.


