A lot of companies are facing the same problem. They have such huge amounts of data, but are unable to get an overview in which all data is unified. When problems occur in their IT stack, they do not know where it originates. Was it a change? An overload? An attack? Or something else?
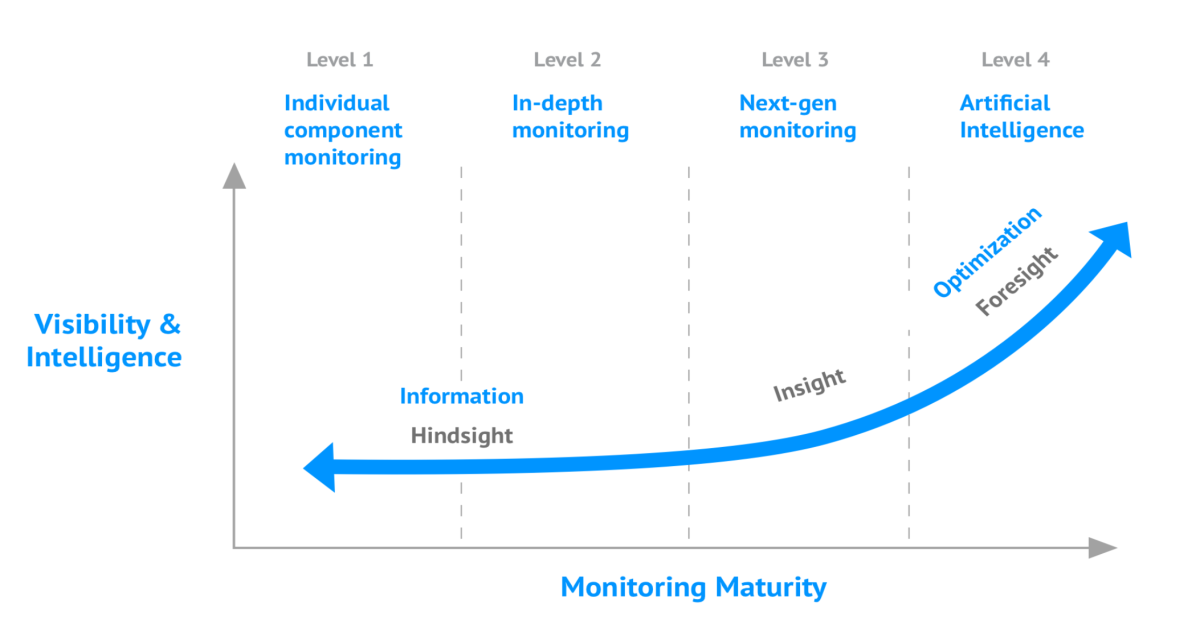
Based on our experience, we have created the Monitoring Maturity Model. At which level is your company? Download the Monitoring Maturity Model whitepaper right here.
Level 1 - Individual Component Monitoring
At level one you can have monitoring solutions for several components. In case something happens in your IT stack, you will see a lot of red dots and you will probably get a lot of e-mails which say there is something broken. However, at this level monitor solutions only report the states and alert notifications per (single) component. There is no overview available that shows a unified output of all these monitoring solutions.
Level 2 - In-depth monitoring on different levels
At this level you are monitoring on different levels and from different angles and sources. This level enables you get more in-depth insights on the systems your own team is using. There are several tools that help you generate different types of data. Tools such as Splunk or Kibana are used for log files analysis. For Application Performance Monitoring tools such as Appdynamics or New Relic are used. Last but not least there are tools such as Opsview that show the component's states of different services. The more kinds of data you have, the more insight you get on the different components. Most of the companies we have seen are at level two of the Monitoring Maturity Model.
Any minor change or failure in your IT stack can create a domino effect in your IT landscape and eventually stop the delivery of core business functionalities. In case something fails somewhere deep down in your IT stack that is affecting your team, at level two of the Monitoring Maturity Model, your team will only be able to see their part of the total stack. They will be unable to see the company's complete IT stack. Therefore, they will not have a complete understanding of the severity of this change or failure that seemed to be minor at first. For this problem, we introduce level three of the Monitoring Maturity Model.
Level 3 - Next-Generation Monitoring
At level three we do not only look at all the states, events and metrics for each single component, but we also look at their interdependencies and significant changes - such as deployments. For this you will need an overview of your complete IT stack. This is created from existing data from your available tools. In order to create this overview you will need to combine data generated by tools such as:
Monitoring tools (AppDynamics, New Relic, Splunk, Graylog2)
IT Management tools (Puppet, Jenkins, ServiceNow, XL-Deploy)
Incident Management tools (Jira, Pagerduty, Topdesk)
By creating full stack observability, each team is able to view their stack as part of the entire IT stack. This enables teams to find the root cause of a failure not only much easier but also quicker. Furthermore, this unified overview helps teams understand and decide which tools they want/need to use. This level of Monitoring Maturity is an upgrade for the entire organisation.
Level 4 - Automated operations with AIOps
The final level of the monitoring maturity model is all about applying Artificial Intelligence for IT Operations (AIOps). AIOps is a new Product Category defined by Gartner. AIOps is a natural evolution of IT Operations Analytics (ITOA) and involves the application of Artificial Intelligence (AI) and Machine Learning (ML) techniques.
Using predictive analytics and continuous Machine Learning, monitoring at level four allows you to proactively detect anomalous behavior across your environments. Early warning signals get your operations teams out in front of upcoming issues and give them the opportunity to prevent the problem from impacting your business. The time gained will at least help them cut down on the issue’s remediation time. At level four AIOps will improve your organisation by:
Sending alerts before there is a failure
Self-healing by for example scaling up or rerouting services before a service is overloaded
Abnormality detection
Advanced signal processing
Curious to discover how mature your IT Monitoring is? Download the free whitepaper here.


