
Maintaining reliable Kubernetes systems is not easy for anyone, especially for team members with less in-depth knowledge of Kubernetes itself and the overall service environment. This blog, part 1 of 3 in the “8 SRE Best Practices to Help Developers Troubleshoot Kubernetes” series, outlines the key challenges SREs and developers face when they need to quickly troubleshoot and remediate issues in applications running on Kubernetes.
Read Part 2 and Part 3 of the series to learn how to address these challenges.
Troubleshooting Kubernetes Today Demands a Sense of Adventure
With Kubernetes powering some of the world’s most important applications, it’s critical to keep your clusters running smoothly. SREs are ultimately tasked with optimizing performance and maintaining reliability for Kubernetes. It’s their job to implement, automate and maintain processes and tools to prevent issues from happening and to quickly resolve them if they do. They probably also help their organization adopt best practices for security, compliance and performance that are essential for success.
Although SREs do a lot of troubleshooting and provide troubleshooting support, often software developers are on call to keep their own applications and services running smoothly. In a typical company, both SREs and developers face many pitfalls on their Kubernetes troubleshooting journey and struggle to find an efficient path.
In January 2023, StackState conducted an informal poll of about 100 practitioners to see what Kubernetes troubleshooting challenges they were struggling with. More than two thirds of respondents struggled with the top two issues.
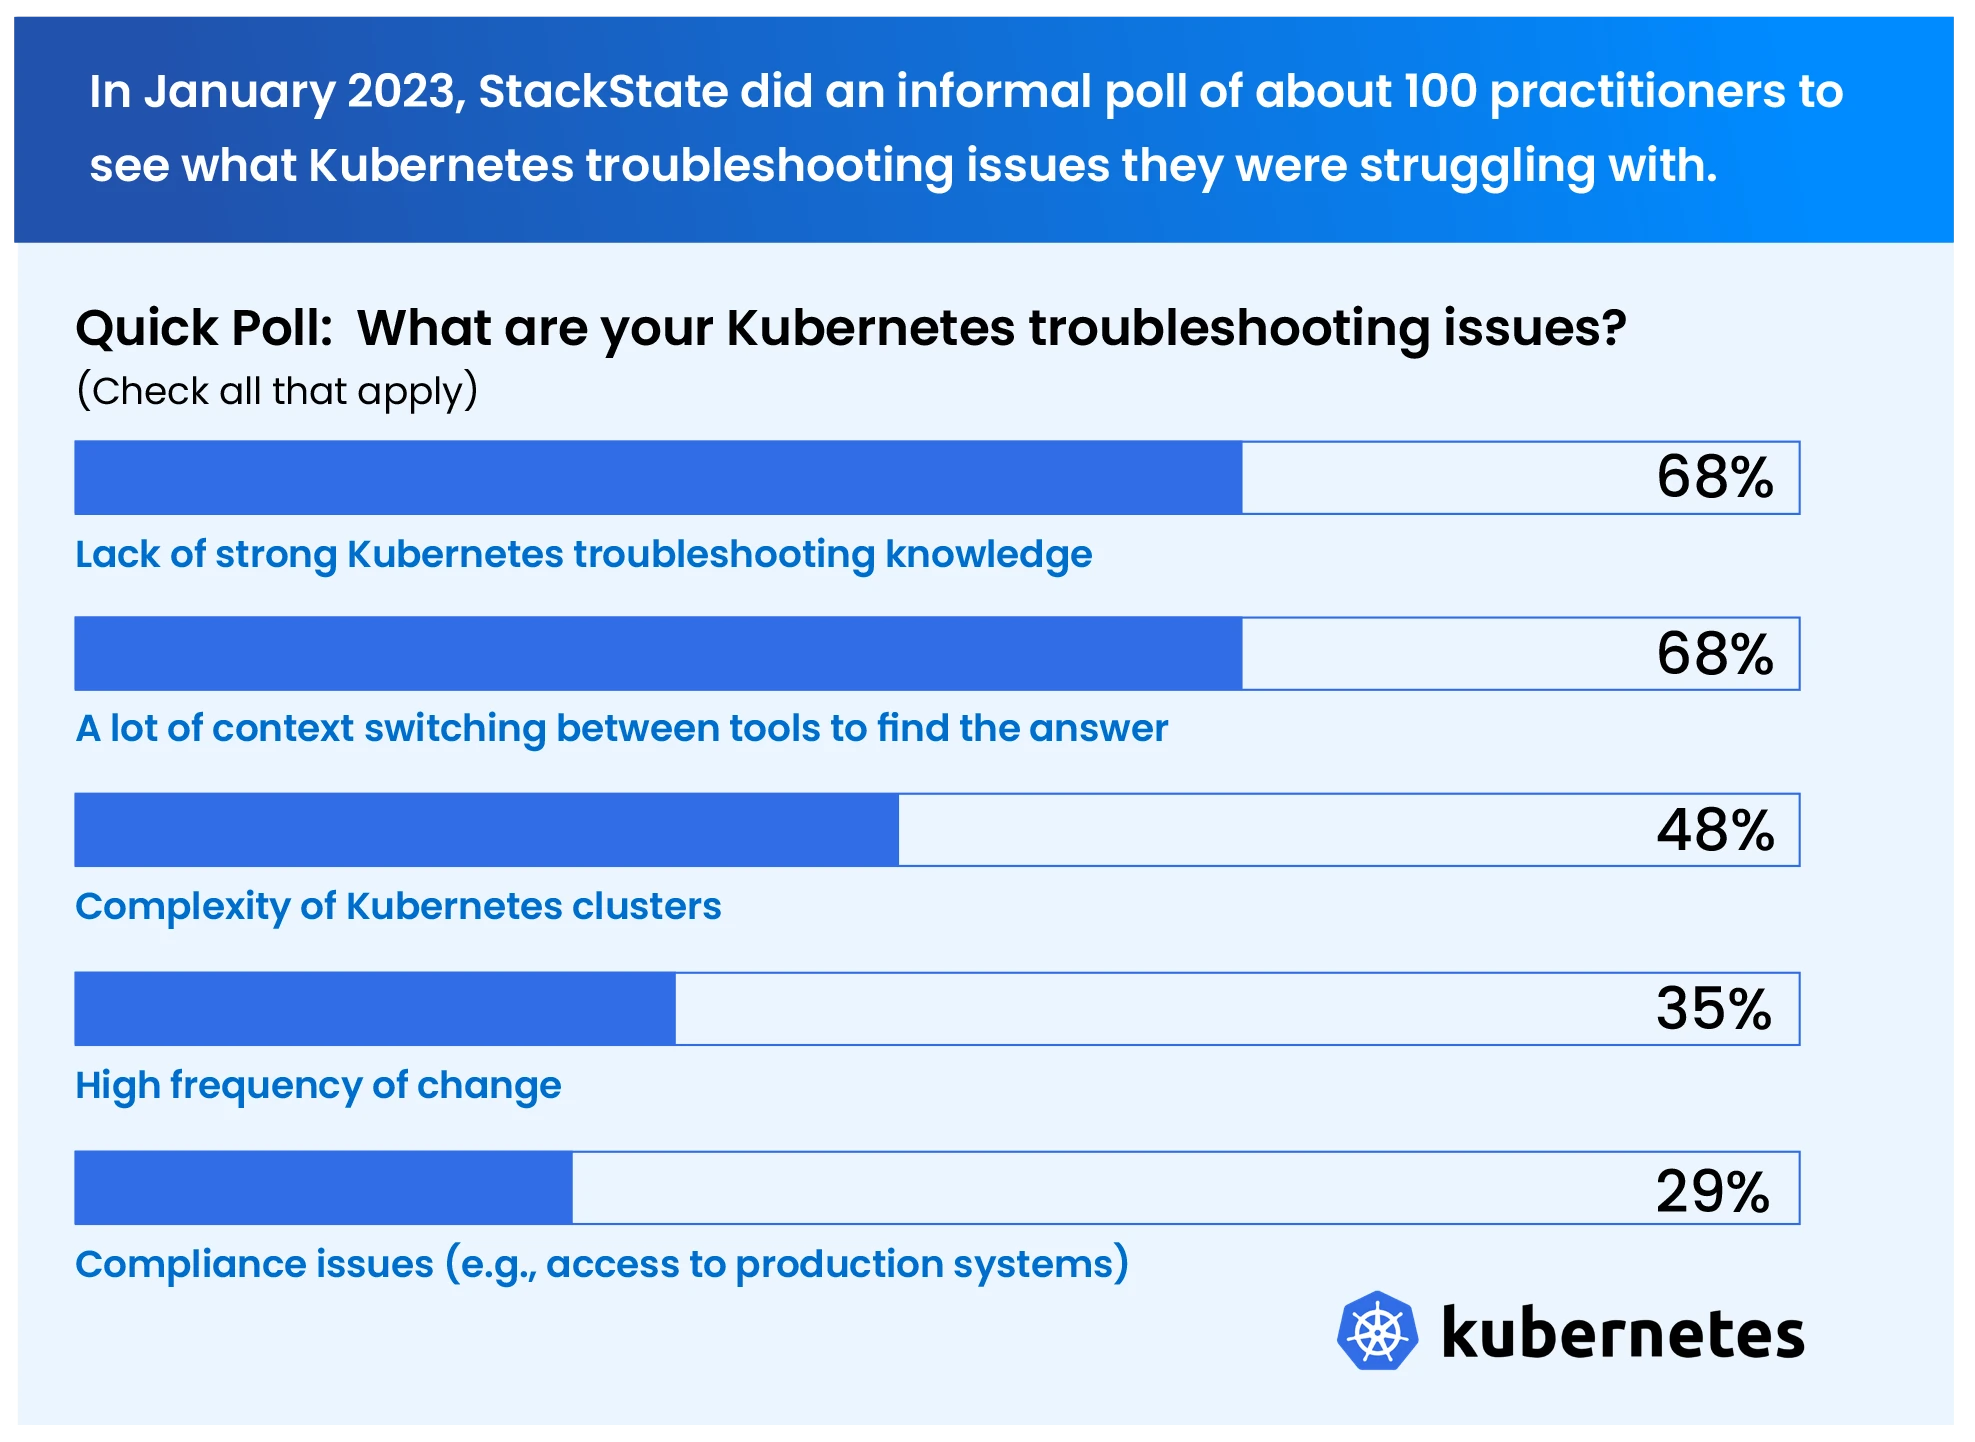
Lack of strong Kubernetes troubleshooting knowledge –SREs probably don’t have deep knowledge of how developers build their services. Likewise, developers probably don’t have deep knowledge of Kubernetes or the overall service environment... much less knowledge of how to troubleshoot it.
Too many tools capturing different types of data – Kubernetes itself lacks useful built-in tools to collect observability data or display it on dashboards, and it also does not store history for very long. Most teams compensate by turning to specialized open source and commercial tools to get these basic capabilities. If you do, you probably need to use several since each tool focuses on a different capability or a different typeof data. It’s slow and frustrating to switch between tools to get the information you need.
High level of complexity combined with poor visibility – Today’s services have many interdependent parts, and complication grows even further inside Kubernetes clusters. Unless you’re the system expert and you’re paying very close attention, it’s hard to understand what’s happening. Worse, most teams have poor visibility across clusters and services. You probably find cluster resources and dependencies very difficult to see and track at a service level, with no correlation between them and no context of how one thing affects another.
Light-speed pace of change – Containers spin up and down, deployments happen continuously, configurations change frequently. With so much change but no holistic tracking capabilities, it can be real challenge to determine which resource caused an issue, especially since that resource’s lifecycle may have ended long before you even realize an issue is occurring.
Compliance issues – Not everyone has the access to all systems, and not everyone knows what steps need to be followed. The more people who need to troubleshoot, the harder it can be to allow access to necessary systems (such as production) while still being in control.
And this is only a high level view of the challenges that result in ineffective troubleshooting, unnecessary toil for everyone, disruptions for engineers called in to help and decreased reliability for customers. SREs often need to support multiple teams of developers as they deploy their services to Kubernetes. To blaze the trail for everyone, they need a strong sense of adventure and a good map.
There Are Many Essential Components in Your Kubernetes Troubleshooting Map
Kubernetes troubleshooters need four different types of observability data to really understand what’s going on: metrics, logs, events and traces.
Metrics are numerical measurements that help you understand the performance and status of services — for example, the famous four golden signals: latency, throughput, error rate and saturation. Metrics are generated by the various components of a Kubernetes cluster, such as nodes, pods and containers. They provide valuable information about resource utilization such as CPU and memory usage. Teams often set up dashboards to view metrics and set thresholds to receive warnings when undesirable performance is detected.
Logs are time-stamped records of relevant events that happen in your Kubernetes environment – e.g., transactions, warnings, errors – that help you understand behavior at a given point in time. In a Kubernetes cluster, there are multiple types of logs (such as system logs, application logs, container logs, event logs and audit logs), each providing detailed insights. Logs can, for example, show you when a resource started to fail and what errors were served. Engineers often use the command line interface (CLI) to access logs and search for errors and anomalies, bolstered by their existing knowledge of their cluster environment.
Kubernetes events are generated for the various components of a Kubernetes cluster when something happens, such as the scheduling of a new pod or the failure of a container. Events also reflect change in status of Kubernetes built-in monitoring probes like liveness probes and readiness probes. Events can be used to understand how resources come and go and how they behave at a deeper level.
Traces are detailed snapshots that show how data flows through an application from end to end. They track a user request as it moves across services so you can see how long each step takes and where behavior may be lagging. The long era trace takes, them are unsatisfactory the customer experience. Traces are a valuable source of insight when you are troubleshooting performance degradation: they provide detailed information about the execution time for each request. Traces also show how all the service components are linked together so you can understand the dependencies in your environment.
Shortcomings in Kubernetes
Adding to the innate complexity of troubleshooting, the monumental volume of metric, log, event and trace data generated by a Kubernetes cluster makes it difficult to locate the details you need to diagnose a problem. Further complicating the process, Kubernetes itself lacks sophisticated built-in tools to collect, aggregate, store, view and analyze data:
Granular collection: Kubernetes does not have a built-in way to collect and aggregate detailed metrics or traces from containers or nodes in a cluster. Although it does collect some high level data, it does not provide a way to collect custom metrics and often there is not enough detail to effectively troubleshoot issues.
Persistence: Kubernetes does not provide persistence for metric, log, event and trace data. If the node fails or the collection process is restarted, for example, the data is lost.
Storage: Kubernetes has limited storage space and thus does not retain data for very long. Before you even realize something is wrong, the details on the event that caused an issue may be long gone.
Visualization: Kubernetes’ built-in dashboards allow limited customization and do not present a complete picture of essential data. They are not comprehensive enough to support the needs of most organizations.
Aggregation and centralized management: Kubernetes does not provide a centralized mechanism for aggregating and managing data such as metrics, traces and logs, and it also does not correlate details between data types or across clusters.
Search and analysis: Kubernetes lacks a built-in mechanism for searching and analyzing data such as logs and traces, which results in a very manual query process for all data types. Data must often be retrieved and analyzed on a per-node basis, making it difficult to get a comprehensive view across your cluster. Engineers do the analysis themselves, relying heavily on their skills and background knowledge.
To compensate, SRE teams typically put external tools in place to address these shortcomings:
Many teams use open source tools like Prometheus to collect metrics and then display them in Grafana dashboards.
Loki, Logstash and Fluentd are open source tools that are commonly used to collect, aggregate, store and analyze logs and to create alerts. Tools like k9s and Lens are often used to show Kubernetes events and provide insight into resource behavior: pods being killed, containers pulled, new containers being started, etc.
Jaeger and Zipkin are open source tools that collect, store and analyze trace information.
Why Is It Such a Rough Road?
Each data type – metrics, logs, events and traces – only tells part of the story. As an analogy, a Google map presents many forms of data that are combined to help travelers along their way: information about the roads themselves, accidents and traffic jams, landmarks, street view, directions, location searching, and route planning for walking, biking, driving and public transport. Similarly with Kubernetes, to see the big picture and get an accurate map to guide your troubleshooting adventure, you need to look at all the data types together and correlate information from all data types across all related services and clusters.
With so many tools – each requiring background knowledge, effective configuration and a lot of manual queries – it takes a lot of work to combine and correlate their data even to create a partial map. Troubleshooting with this multitude of tools, especially open source tools that require extensive configuration, is a rough road:
Switching between tools: If you want to look at metrics for a different cluster (or different resources in the same cluster), dive deeper from services into pods or just understand the bigger picture, you have to switch back and forth between dashboards. You lose a lot of time executing manual queries and switching between tools and views... and you are likely overwhelmed by the amount of data.
Lack of context: Using multiple tools can give you a good understanding of the actual behavior of an individual component or a set of components, but you likely need more context to understand the big picture – you have too many disconnected dashboards and no way to see how things fit together. And you don’t have insights into how different services and resources are related, so you can’t tell how an issue with one service might affect other things.
Scattered and uncorrelated data: Troubleshooting data is not accessible in a central place and is not correlated. Even switching between multiple tools and doing multiple queries, you often don’t have enough information to find the cause of an issue, which may require correlated insights across components and over time.
Lack of skills to set up useful monitors and dashboards: Your teams, especially those who are new to deploying applications to the cloud, may struggle to set up good dashboards and monitors. They don’t know what charts they need to see and what thresholds to set for alerts.
It’s hard enough for an SRE to bring everything together, but for a developer on call, who is not a Kubernetes expert nor an expert on how everything fits together, it can be impossible.
What can you do to make things easier for everyone...?
Read our new white paper, 8 SRE Best Practices to Help Developers Troubleshoot Kubernetes, to find out!
Read Part 2 and Part 3 of this blog series.
Try StackState free! We provide the most powerful troubleshooting tool available for applications running on Kubernetes.


