The StackState Agent
Many organizations lack the ability to provide deep insights into the health of their ever changing infrastructure. We're pleased to announce the new StackState agent, which job is to collect events and metrics and provide StackState users with full visibility into their infrastructure.
The StackState agent discovers all running processes and their dependencies on other processes. It integrates with 50+ different technologies like Docker, Nagios, NGINX, Kafka and Hadoop. The agent sends all discovered data to the StackState API which uses its synchronization framework to synchronize the real-time topology with StackState. This mapping is done by using different templates for all technologies.
If you're interested in learning more about how StackState combines all available data into a real-time model of your infrastructure, here's an awesome article from Mark, one of our co-founders.
Elasticsearch Monitoring
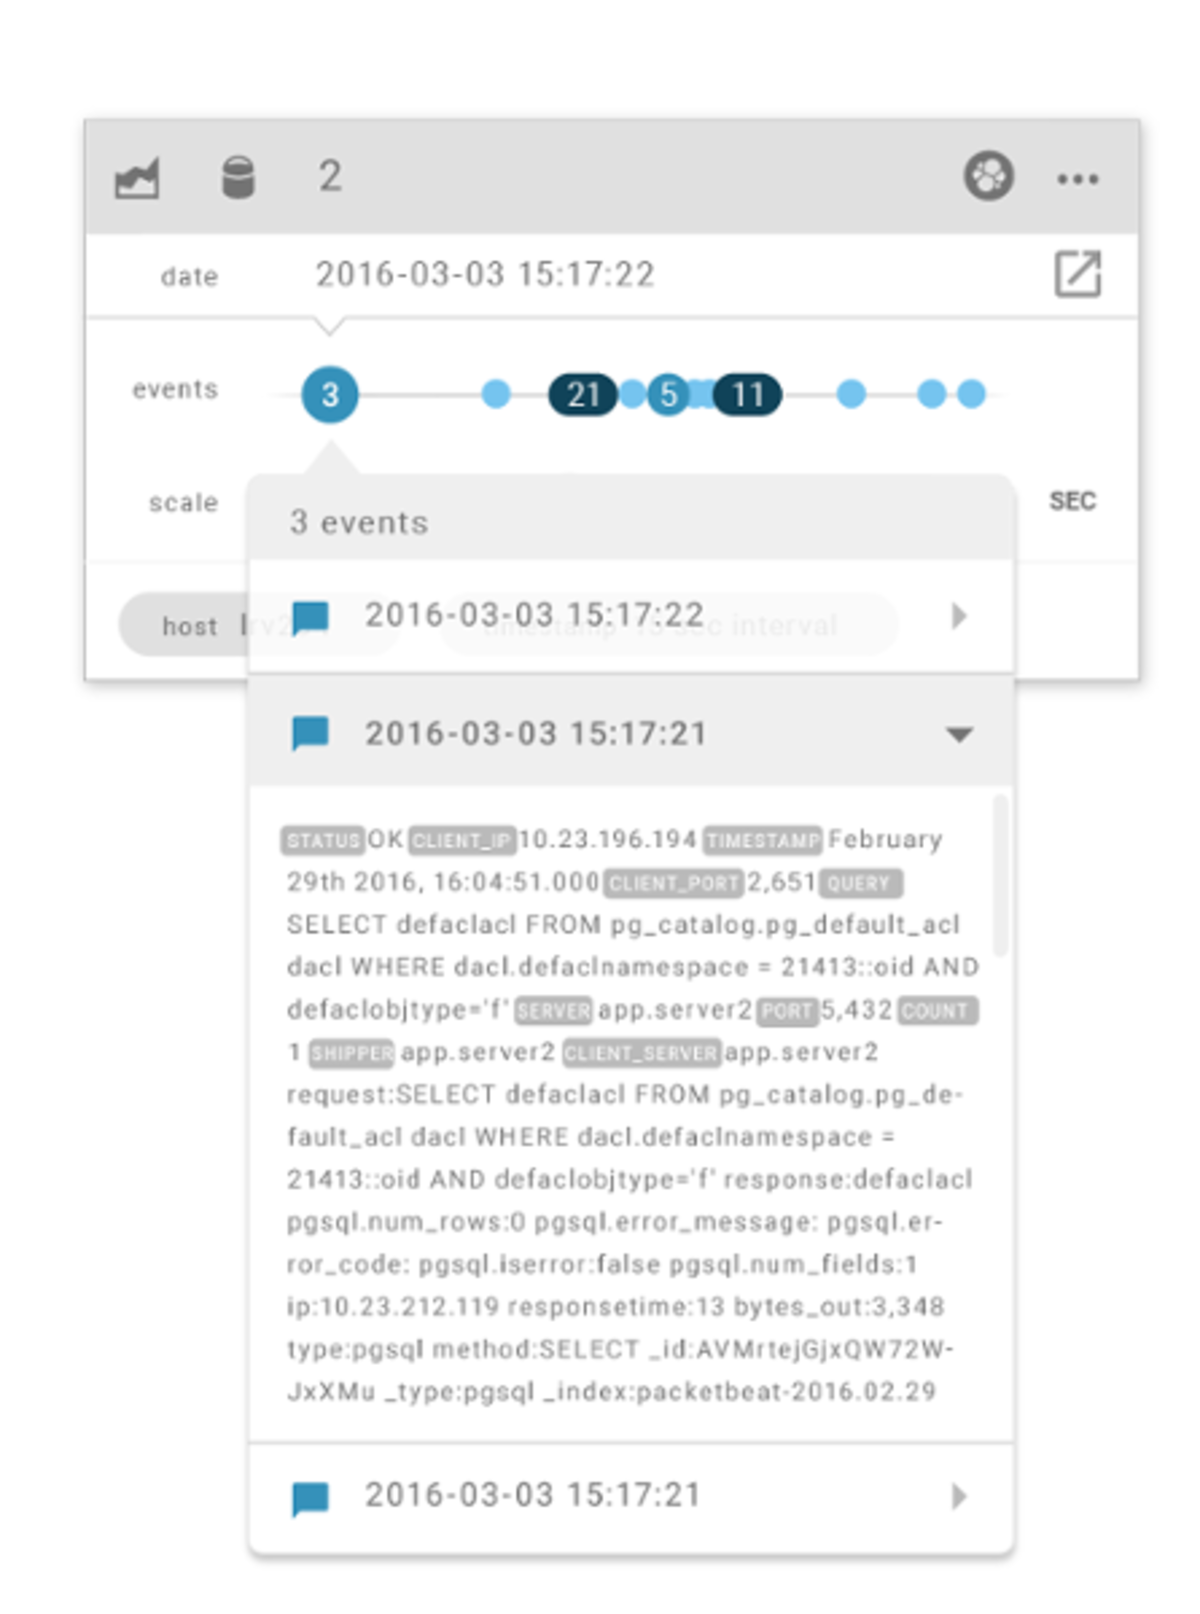
You’ve done all the hard work to set up Elasticsearch and you finally master the skills you need to get started. Now it’s time to maximize your efforts.
With the new Elasticsearch integration, you can show the right log files in real-time by just clicking on a component. No need to read through possibly multiple log files or an entire file to see what application was doing before the problem happened. With StackState, you just click on the component and it automatically shows the log files and other relevant information you need.
With StackState and Elasticsearch, you can also:
enrich your log files with contextual information coming from other tools and technologies in use like AppDynamics, Splunk, New Relic, Nagios, Docker and many more
alert on information found in your log files
detect anomalies in log data
Click here to request a demo and to learn more about using StackState and Elasticsearch.
Introducing Team View Alerts
We’re always thinking about how we can make it easier for Dev and Ops to understand the alerts you're receiving from all the different tools – to tell you where to focus, to give insight into what happened in the stack and how you can solve (or even prevent) an outage.
That's why we introduced team view alerts.
In StackState you can add checks on single components, but also on a specific team view or part of the IT stack that you're monitoring. With StackState, it’s easy to create a specific team view of the stack. This view consists of multiple components, dependencies and other relevant information fed by our own agent and the different DevOps tools you use. Each team view has an overall consolidated state that's based on this information. This view state is clearly visible and will only trigger an alert notification when the TOTAL state of the stack that your team is monitoring changes from state.
StackState's alerting capabilities makes it easy to send alerts directly to Slack, Pagerduty or to notify you via your own favorite notification tool. Whether you’re using 1 tool or 50, when you receive an alert, it’s not one to ignore.
A Few Smaller Things...
StackState is also able to integrate with Opsview, so users are able to correlate their Opsview data with other relevant information and tools.
We’re a proud sponsor of the upcoming Splunk .conf 2016!
Our announcement will follow soon;-)
PS. Want A T-Shirt? Of course you do :)
We just got a truckload of new StackState swag and we’re itching to get it off our hands.
So here’s the deal.
Read this post , give me your honest feedback, email me (jcompeer at stackstate.com) and I’ll send you some of that fresh swag.


