StackState AIOps analyzes metrics, logs, events and other data in order to deliver a broad and unified view of IT systems, and to assist teams in discovering the root cause when problems occur.
Full Stack Visibility and Monitoring for Windows
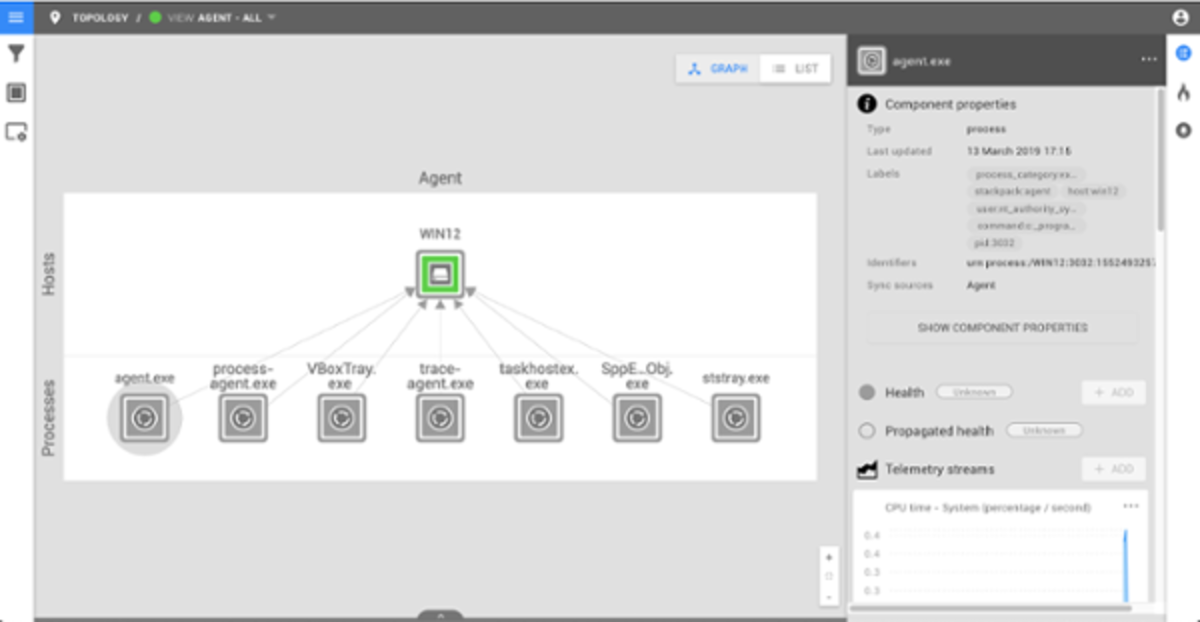
The Windows Agent is able to create a real-time and full stack topology visualization of a users' environment, including the processes, services, applications and hosts across multiple servers and operations systems. This enables users to see which processes connect to other processes and how they are related to the overall IT landscape.
In addition to this, each discovered component has all telemetry automatically attached, which gives you access to the network IO of a specific process in a single click. The agent also collects tracing information to offer insight about throughput, latency and errors per second.
Centralized Overview Of Your IT Landscape
A lot of enterprise IT organizations are using multiple tools to monitor different technologies and are struggling to get a centralized overview of their IT landscape. With StackState, you are able to see your Windows processes running on top of your AWS infrastructure and have the ability to see all details from both worlds without the need of switching between tools. This is a huge timesaver and productivity boost for IT teams.
451 Research recently published a report about how StackState tackles monitoring data silos and how it provides enterprise IT organizations with a centralized overview of their applications and infrastructure performance.
"Rewind" Visualizations In Time
But more than that, users can dig into incidents by moving a slider along a timeline to see when a metric spikes, and correlate that spike with the cause, such as a new code push. This way you can use StackState as a movie recorder that shows which processes were connected to which processes at any moment in time, combined with all important metrics, event and logs. This enable users to view the order of events as they troubleshoot the root cause.
If you would like to learn more about StackState and how it supports your specific technology stack, feel free to request a guided tour right here . We are more than happy to walk you through the platform.


