During the last few weeks StackState has seen some huge improvements, so it’s time to catch you up on all the cool stuff we made last month. Let get right to it…
Mesos integration
Monitoring your containerized infrastructure can be challenging. Containers move and change so frequently, that it’s more difficult to get an overview of your container landscape – especially at scale.
That’s why we want to highlight our new Mesos integration. Using Mesos and StackState together, it’s easier for you to monitor your containerized infrastructure. You are now able to automatically discover, visualize and monitor your containers while keeping track of the containers that are running. Whenever a container is stopped or destroyed, StackState will understand that too.
Using StackState and Mesos together, enables you to:
Visualize all the dynamics of your containers and their dependencies;
Know how many containers are running for what amount of time;
Apply automated root cause analysis on bottlenecks across your containerized infrastructure
New fresh user interface
One of the reasons we built StackState was to bring a consumer-grade experience to enterprise software. To provide the same simplicity, easy of use, and pain free delight of popular products, such as Slack, Google and Facebook.
StackState reinvented operational analytics with the user in mind. By approaching operational analytics from a user perspective, we’ve distilled a complex and hard process into a whole new experience. Monitor your entire IT and Business landscape in seconds. Find the cause and impact of any change or failure instantly. Create different team views of your landscape with a few clicks. This is Operational Analytics at scale. Simplified.
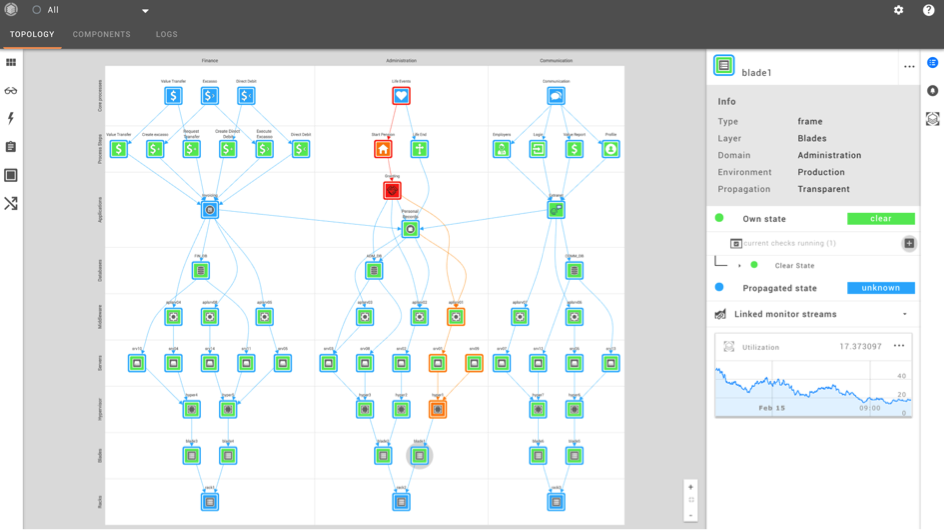
The entire experience has been re-designed to give you a better view of your critical business services and their underlying infrastructure components. See the screenshot below to get a first impression of the new user interface of StackState. What do you think? Your feedback is more than welcome!
ServiceNow integration
Here at StackState, it’s all about adding value to your existing tools. That’s why we are excited to tell you more about our ServiceNow integration.
Your CMDB contains a lot of valuable and relevant information. The new ServiceNow integration enables you to automatically derive this information into StackState and combine it with other data coming from your existing tools (such as monitoring-, provisioning- and container management solutions). Out of all this information, StackState will provide a real-time overview of your entire IT and Business landscape.
Using ServiceNow and StackState together enables you to:
Merge ServiceNow with other topology and telemetry sources to create one single source of truth
Give each team its own view of the total landscape (and get the right data to the right people!)
Add a
utomated Root Cause Analysis capabilities to reduce MTTR
Enrich tickets with relevant information to deep dive into any issue - from the ticket itself down to the relevant telemetry information such as metrics and logs.
We have a whole lot more to come for the next few weeks for ServiceNow users. Curious how you can use ServiceNow and StackState together? Request a demo here and we'll walk you through our solution.
New way of viewing your components
Keeping everything up and running requires focus. Especially when the scale of your enterprise would otherwise consume all valuable effort this focus can have enormous costs. Therefore, you need to have total control of what’s happening in your landscape. Being able to kill the noise, preferably automatically, is of huge importance.
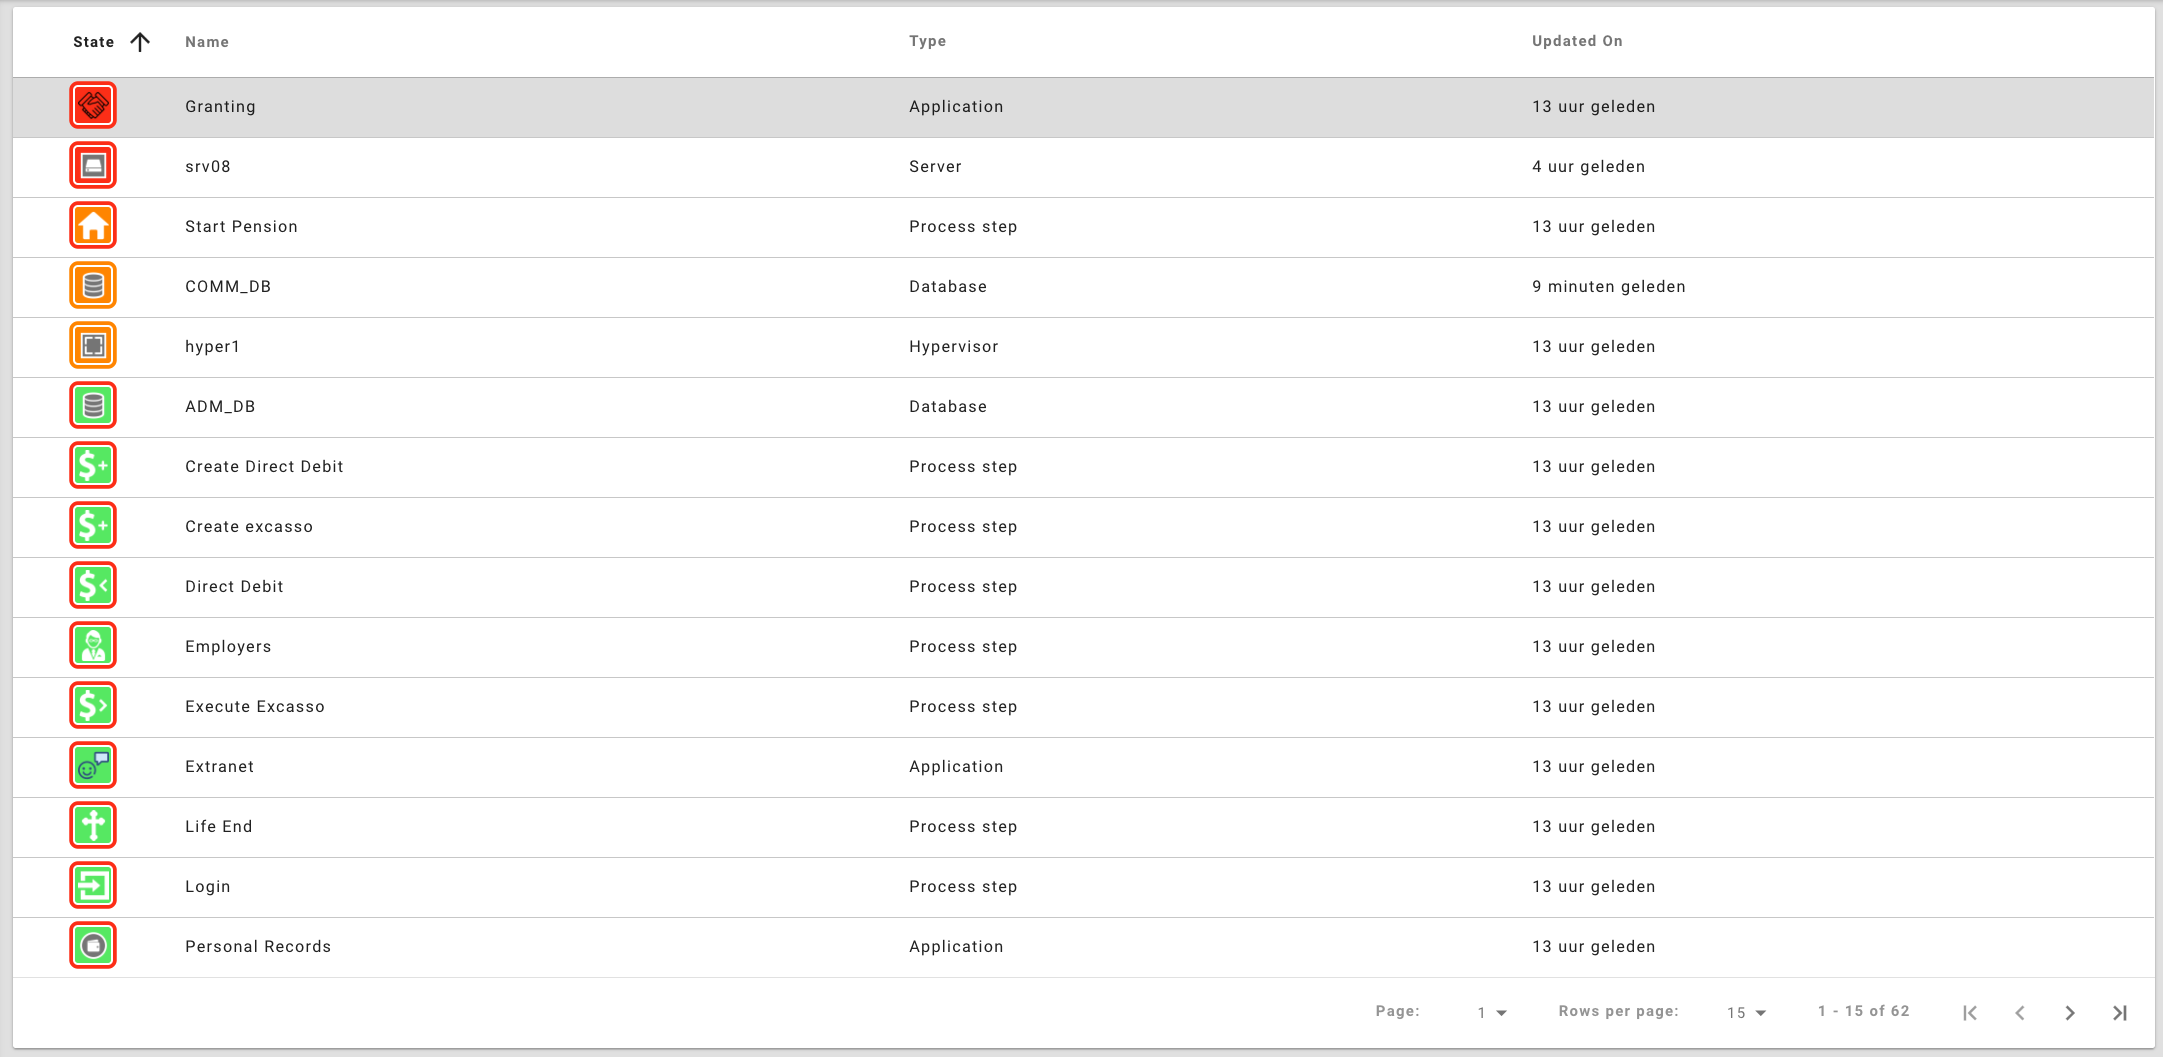
To help you along the path of investigation StackState now introduces the new List View.
Instead of referring to your infrastructure from a Topology point of view, you can now scroll through these components as they are enlisted by state, type, name, and duration. This allows you to rapidly determine the possible failures of Critical or Fatal components. It’s a whole new way of looking at the health state of your components. Filter the view by state and see the number of components that are in a critical state and REALLY need your attention. To view specific component details, click on the row and check the details to be displayed.
That's it for this month. As always, don't hesitate to shoot me an email (jcompeer@stackstate.com) if you need more information or if you have any questions or remarks!
About StackState
StackState provides a real-time overview of your entire IT and Business landscape based on a unique unifying model. Business services and processes and all supporting infrastructure, soft- and hardware are included. StackState pulls in data from operational tools you are already working with: monitoring, container management solutions, infra tooling, etc. and comes with an agent to fill the gaps where necessary. There will be no surprises left in your stack! We make sense of large and complex environments.


