
AIOps platforms are able to work with existing data sources, including traditional IT infrastructure monitoring, log aggregators, APM, container- and cloud monitoring tools. This data-agnostic approach is important to gain context and visibility across your tools. With context you're able to relate data to one another, to accurately pinpoint problems, predict future incidents and understand which changes will impact business critical processes. In this post, I will explain the benefits of integrating your Zabbix tool with StackState .
What is Zabbix?
Zabbix is an enterprise open source monitoring tool for networks and applications. It is designed to monitor and track the status of various network services, servers, and other network hardware. Zabbix provides monitoring metrics, among others network utilization, CPU load and disk space consumption.
Gain context and visibility across your entire IT landscape
Setting up items and triggers in Zabbix can be quite an investment for an organization. Capitalize on this investment by connecting Zabbix to StackState and benefit from StackState’s ability to combine different data sources and apply machine learning to the data streams. With StackState you don't have to jump from tool to tool trying to understand what issue happened. StackState aggregates, analyzes and provides context to Zabbix events so that you can repair and restore IT issues quickly.
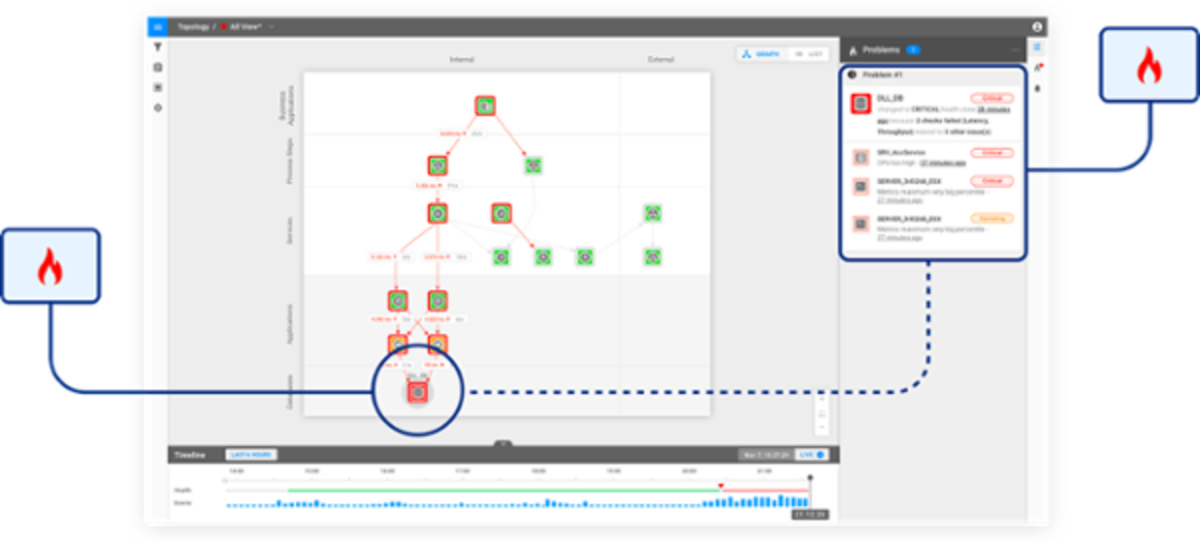
By integrating topology and health state events from different monitoring tools, StackState can quickly create a picture of your complete IT landscape. Piggyback on the alerts from Zabbix to give every team one source of truth for their applications. Then use advanced features like time travel and prediction to get ahead of the game.
Enhance your Zabbix investment with StackState
Here’s how the Zabbix integration delivers value to users:
Real-time visibility, zero blindspots.
Enterprises are using multiple monitoring tools to monitor different layers of the IT landscape. The data-agnostic approach of StackState allows you to connect data from Zabbix with other, domain-centric tools. In this way, you consolidate insights
that were previously locked in siloed domains. The result? Real-time visibility across teams, tools and domains with zero blindspots.
Reduce the noise. Aggregate and correlate Zabbix alerts into a single place and understand which alerts matters the most. StackState automatically identifies issues that are likely to related in cause and cluster them together, so you aren’t deluged with cascades of individual alerts when problems occur.
Efficient and quick troubleshooting. Auto-detect issues and immediately know what you can do about it. StackState's unique versioned graph database enables our users to save each event as a snapshot and watch in detail how components in your environment were affected over time .
If you would like to learn more about StackState and how it supports your specific technology and tool stack, feel free to request a guided tour right here . We are more than happy to walk you through the product.


