Improved Impact Analysis
This is a big one. As an IT Operator you’re probably responsible for a set of virtual machines, databases and applications. It’s your job to keep track of everything that is happening and to keep the lights on.
Suppose you have to reboot a VM. You want to know which parts of the IT landscape could be affected due to the reboot you want to apply. In order to get this knowledge, you need to be aware of all the dependencies between your VM and the rest of the IT landscape. That’s why we’re introducing instant search with StackState.
Instant search
With StackState you’re able to search for components in your environment and discover their dependencies with the rest of the environment.
As the user types the query, StackState expedites the query by displaying suggested search results with auto-complete functionality. With just a click, the user can instantly locate a specific component and see how it depends and relates on other components in the chain.
This will give you the ability to become more ‘chain-aware’ and to better understand the business impact when maintaining or changing specific, critical components in the IT landscape.
Grouping of Components
At StackState we are constantly working with the end-user in mind to help them monitor and manage their dynamic and scaled environments – especially at enterprise scale.
In an enterprise organization with thousands of services, applications, virtual machines and databases it is hard to visualize this in an understandable way. Here’s an example of what that would look like with the previous version of StackState.
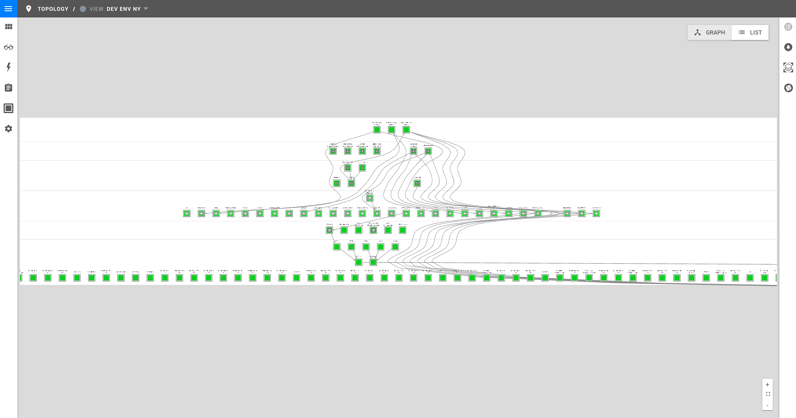
It’s too hard to understand, right? That’s why we are excited to introduce the new grouping functionality.
Now you are able to group components by type and state. Instead of displaying each and every single component, it will now create a bigger hexagon component that consists of components with the same type and state. It looks like this.
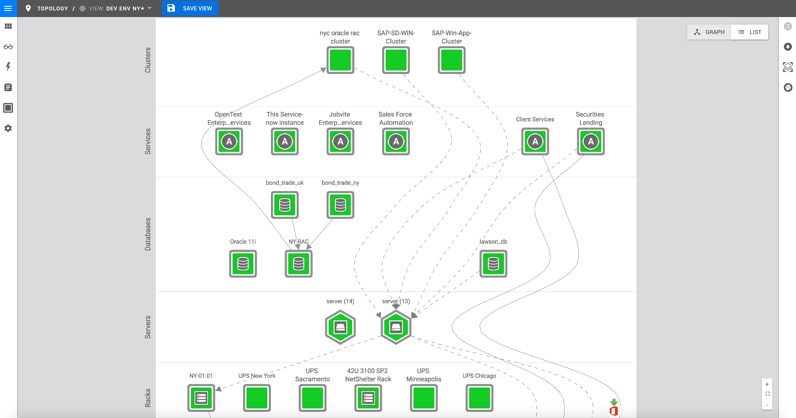
Much better.
Container-Native Monitoring
Containers are a great technology for software delivery and operations, but if you want to use them at enterprise scale – beyond individual experiments – there are critical monitoring and management considerations that you can’t overlook, or you will create a painful and costly minefield.
We know that it’s essential to monitor the different components of your orchestrated containers with the rest of your IT landscape. That’s why today, we’re announcing our integrations with Docker, Kubernetes and Mesos to provide you with a complete picture of your containerized landscape.
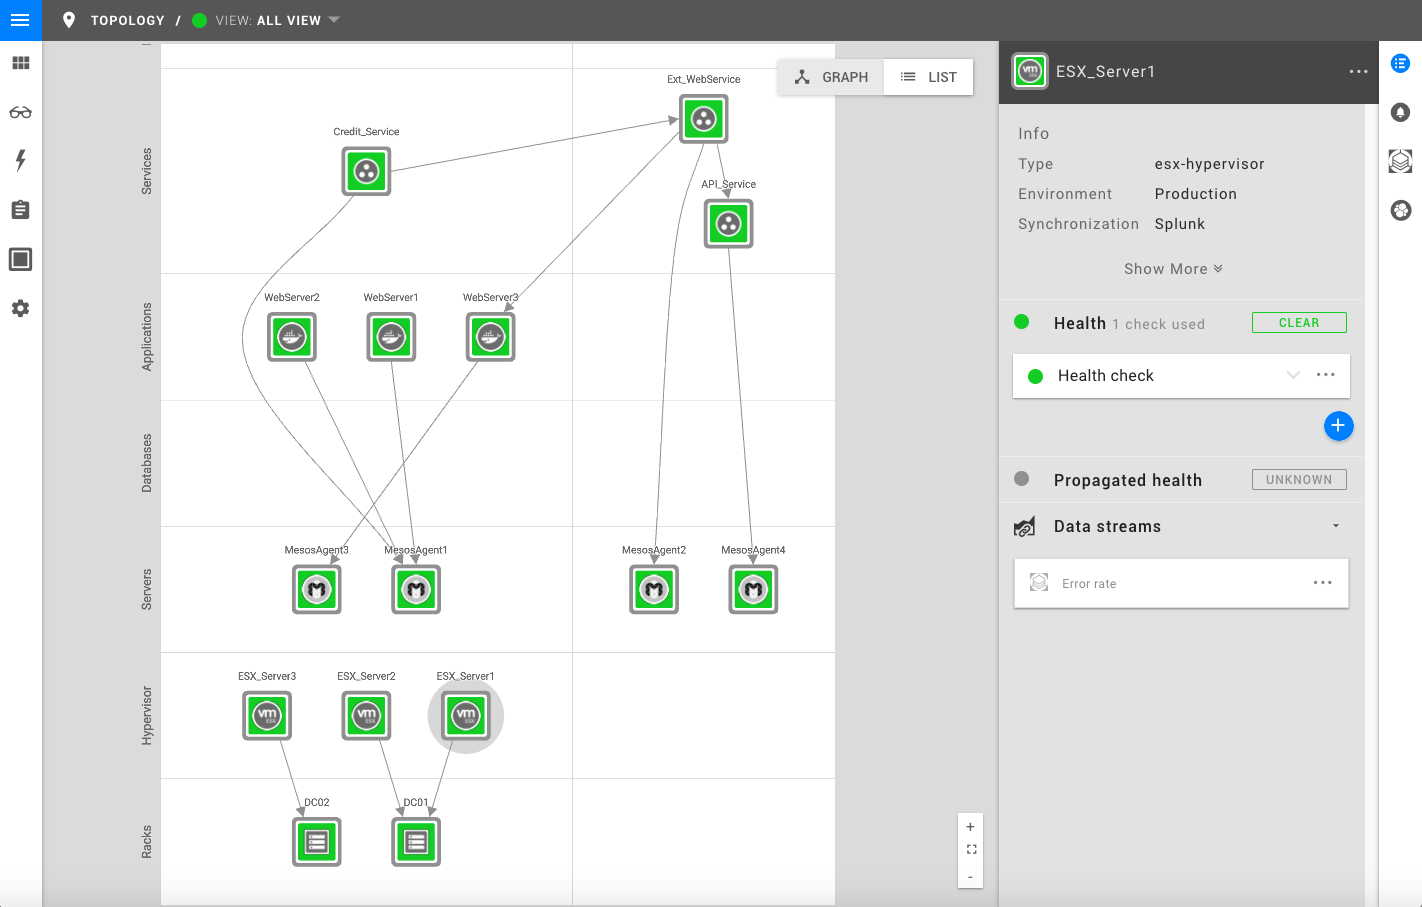
Thanks to StackState’s agent, you can continuously monitor your containerized environments with interruption even as they expand, contract and shift across other containers and hosts:
Natively aggregate container topology and telemetry (such as metrics, events and labels) information for better accuracy in your monitoring.
All services, clusters, nodes and pods (including their dependencies) are automatically synchronized
With 100+ integrations, StackState allows you to monitor everything that is running inside your containerized landscape.
To learn more about how container monitoring works, check out our documentation right here .
Splunk Integration
If you’re a Splunk customer, you’ve bought in and made the decision to invest in machine data.
You’ve been running the entire Splunk playbook – from creating amazing dashboards, to getting deep insights, and optimizing the business performance. But there’s a problem: As a Splunk user, it still remains hard to understand the bigger picture and how different information pieces relate to each other. And that’s why today, we’re announcing our integration with Splunk, so you can fix that problem and start delivering insights with fewer queries that provide value beyond the traditional log analytics Splunk is built upon.
Visualizing Topology From Splunk Data
Having a real-time topology view of your entire IT landscape is the start of understanding how IT components and services are relating and depending to each other.
StackState is able to execute Splunk queries and convert the results to topology elements, which are then synchronized to StackState. In order for StackState to convert the results to topology elements, the output of the query has to be according a format, which you can find right here .
Troubleshoot Faster With Chain Awareness
Classical monitoring on the basis of telemetry alone, which is still mostly the norm nowadays, provides little insight into the big picture of what is happening because of the large volumes of unconnected data. That’s why you need the topology too.
You see, in order to understand what is happening in the ‘chain’, there must first be a model of the IT landscape. With the new Splunk integration StackState is able to see the exact root cause and the components in the ‘chain’ that caused the issue. This will help you better understand the business impact and where to focus.
Other Use Cases
Use StackState and Splunk together to:
Apply anomaly detection and prevent outages and slowdowns
Monitor the compliance of IT components
Become aware of the occupancy of your entire IT environment
A Few Other Announcements
StackState has been selected by Enterprise Management Associates as an “EMA Top 3” vendor in the category for Full Stack Monitoring.
We are proud sponsor of the at the Jaarbeurs in Utrecht on November 1-2. Feel free to join us at booth #01.FL01 for a live demo, giveaways and more.
Together with our friends from Splunk we’re organizing the Splunk Live! Conference on November 21st in Utrecht.


