Better UX, AI, Data Quality & Scalability
This release is another step to enable fully autonomous IT operations using our 4T Data Model®. This model delivers insight into your entire IT landscape by capturing every millisecond of change, from any source in real-time to solve or prevent IT issues faster, with the right team. With this new release, we are making strides in four areas:
Better UX - The previous 4.0 release introduced “Perspectives”. A perspective is a way of looking at the 4T Data Model. Think of each T as a dimension, your IT's entire space, spanning across infrastructure, applications, and business. In this release, we've enhanced the navigation for those Perspectives to find root causes lightning-fast. This also concerns the 'views.' A view in StackState is a looking glass in the form of a four-dimensional cube. Finding the root cause of a problem is a process of elimination that narrows the cube volume. Which side of the cube you are looking at is determined by your perspective. Finding something in the 4T Data Model is a matter of shrinking (narrowing the view) and rotating the cube (changing the perspective).
Plug and Play AI - This release marks the birth of our fully autonomous AI. Previously the AI features of StackState needed some manual configuration requiring both data science and domain knowledge. Our new autonomous AI is plug & play! Turn it on, and it starts producing meaningful results that help you achieve your goals.
Improved Data Quality - With the previous release, processing distributed traces from multiple sources was already possible. Now, this capability is extended with a Trace Perspective, which helps you to quickly find slow or erroneous parts of your (distributed) system.
Scalability - StackState is built for large enterprises where all the data is present, but the understanding is lacking. That's why we've chosen to use Kubernetes as our deployment platform. This enables StackState to run with ease both on-premise and in the cloud at scale, self-managed or managed by us. This release, we're removing the beta label from the StackState Kubernetes deployment.
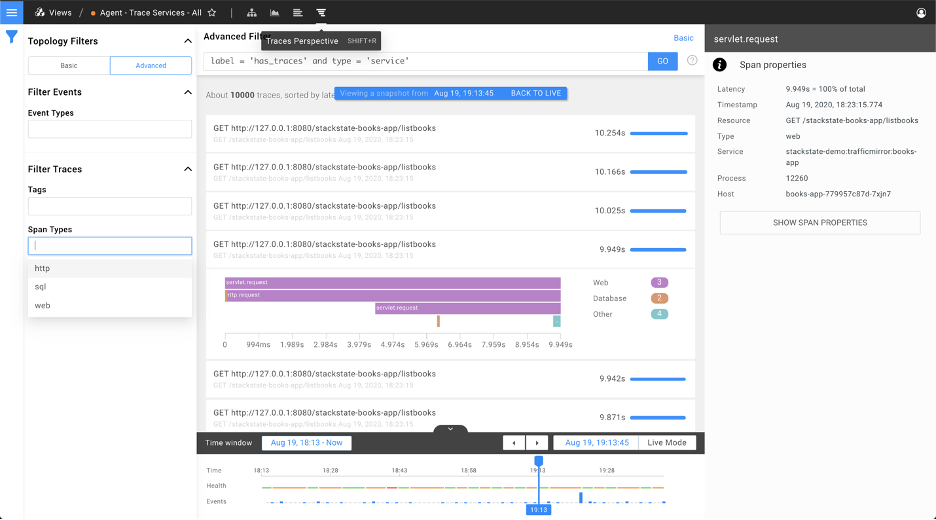
Trace Perspective
Traces, also referred to as transactions, reveal how requests to various services in IT environments are passed down until finally the request is fulfilled or an error occurs. Traces are useful for identifying performance bottlenecks and understanding how different traffic types are affecting distributed systems.
StackState previously supported traces as a source of topology and telemetry. But the traces themselves were not exposed...until now. This new perspective helps you identify root causes and performance issues even faster.
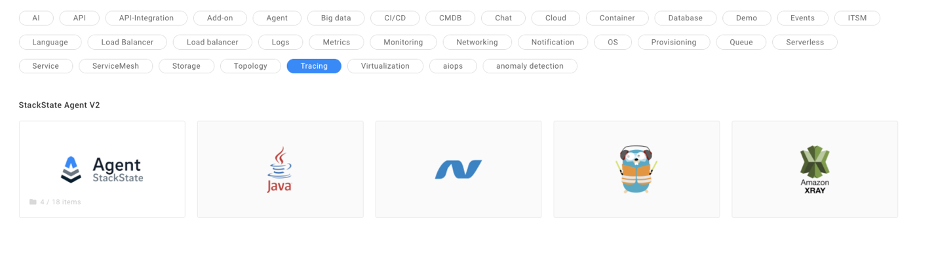
Traces are gathered by the StackState trace agent for Java or .Net services or retrieved from existing trace sources such as AWS X-Ray and Traefik. To get started with any of these sources, go to the StackPacks page and select "Tracing" from the tags.
Autonomous Anomaly Detector
Anomalies are a way of identifying abnormal behavior and are especially useful for:
✔️ Assisting root cause analysis.
✔️ Identifying interesting behavior.
✔️ Alerting on abnormal behavior.
StackState already offers anomaly detection based on metric streams, which requires several configuration parameters per metric stream type (see the docs for this). Figuring out how to configure an anomaly detector based on reasonably complicated algorithms and understand the data puts a burden on the user. The Autonomous Anomaly Detector (AAD) is a fully autonomous AI feature that removes this burden.
Autonomous = Zero configuration. Once you've installed the Autonomous Anomaly Detection StackPack, anomalies will automatically start flowing in.
Autonomous Anomaly Detection scales to large environments by prioritizing metric streams based on machine learning and user preferences. Streams with higher priority are given more attention by the Autonomous Anomaly Detector, thus effectively balancing the number of resources required by the algorithms and the value it provides. Auto Machine Learning (AutoML) is used to determine how to best approach anomaly detection for a set of streams.

Beta program
The Autonomous Anomaly Detector StackPack is generally available for everyone as part of the 4.1 release but still has a beta label. We're starting a beta program with our customers to further tune the machine learning algorithms and models used by the Autonomous Anomaly Detector to minimize false positives and maximize true positives in real production environments. If you would like to join, please contact us.
The Autonomous Anomaly Detector requires that StackState is deployed on Kubernetes.
With StackState, we can monitor our customer's IT landscapes within minutes from deployment and save hours of configuring and maintaining metric thresholds using Autonomous Anomaly Detection.
- Dennis Loos, Solution Architect at CTAC
StackState on Kubernetes
StackState can now be run on Kubernetes. This allows you to run a highly available version of StackState on-premise or in the cloud, using the same underlying infrastructure technology. Installation is performed using Helm, the standard package manager for Kubernetes.
Supported Kubernetes platforms include OpenShift, AKS (Azure Kubernetes) or EKS (Amazon Kubernetes).
Starting with 4.1, StackState on Kubernetes is the preferred method of installation for StackState. The following features are only available when running StackState on Kubernetes:
✔️ High availability with auto fail-over.
✔️ Autonomous Anomaly Detection.
Deprecation schedule for Linux packages
For this release, StackState can still be deployed using Linux packages. However, please be aware of the deprecation schedule for Linux packages:
✔️ For the next major release, tentatively named 4.2 and scheduled for December 2020, Linux packages will be deprecated.
✔️ For the following major release, tentatively called 5.0 and planned for March 2021, Linux packages will no longer be made available.
✔️ Product releases are supported for the duration of the next two major releases. That means Linux packages for 4.2 will be kept until at least June 2021.
Many other improvements
Global 4T navigation - Regardless of whether you are in the topology, telemetry, events, or the newly released Trace Perspective, you can now filter down on all dimensions with the same set of filters and easily change perspectives with a nice set of icons.
✔️ Starred Views - It is now possible to create favorite views by starring them. Starred Views appear as shortcuts in your main menu.
✔️ A binary version of the StackState CLI is now available for both Windows and Linux.
✔️ Agent integration monitoring - StackState agent instances appear automatically as components inside StackState, including a check and event stream that makes it easy to monitor their performance
✔️ Many new integrations, like: Support for Docker Swarm, Nagios ITRS OP5 and Humio.
✔️ Many UX improvements - We've listened to your input and improved many user interface experience parts.
✔️ Many performance enhancements - The overall responsiveness of the product experience and the amount of 4T data StackState can handle has improved. Performance improvements were mostly focussed on topology synchronization and on the speed of state changes in checks and views.
Support
StackState offers technical support for the three most recent major releases. StackState 4.1 marks the End of Life (EOL) of the StackState 1.14 version range. Consequently, this version of the product will no longer be supported, and we encourage customers still running the 1.14 version range to upgrade to a more recent release.
About StackState
StackState's Topology-Powered Observability platform lets you manage your dynamic IT environment more effectively by unifying performance data from your existing monitoring tools into a single topology. Enabling you to:
✔️ Decrease MTTR: Decrease MTTR by 80% by identifying the root cause and alerting the right teams with the correct information.
✔️ Fewer Outages: Reduce the number of outages by 65% through real-time unified observability and more planful planning.
✔️ Faster Releases: Increase application releases by 3X by giving time back to developers.
Get started today with our free guided demo.


