Ready to see it in action?
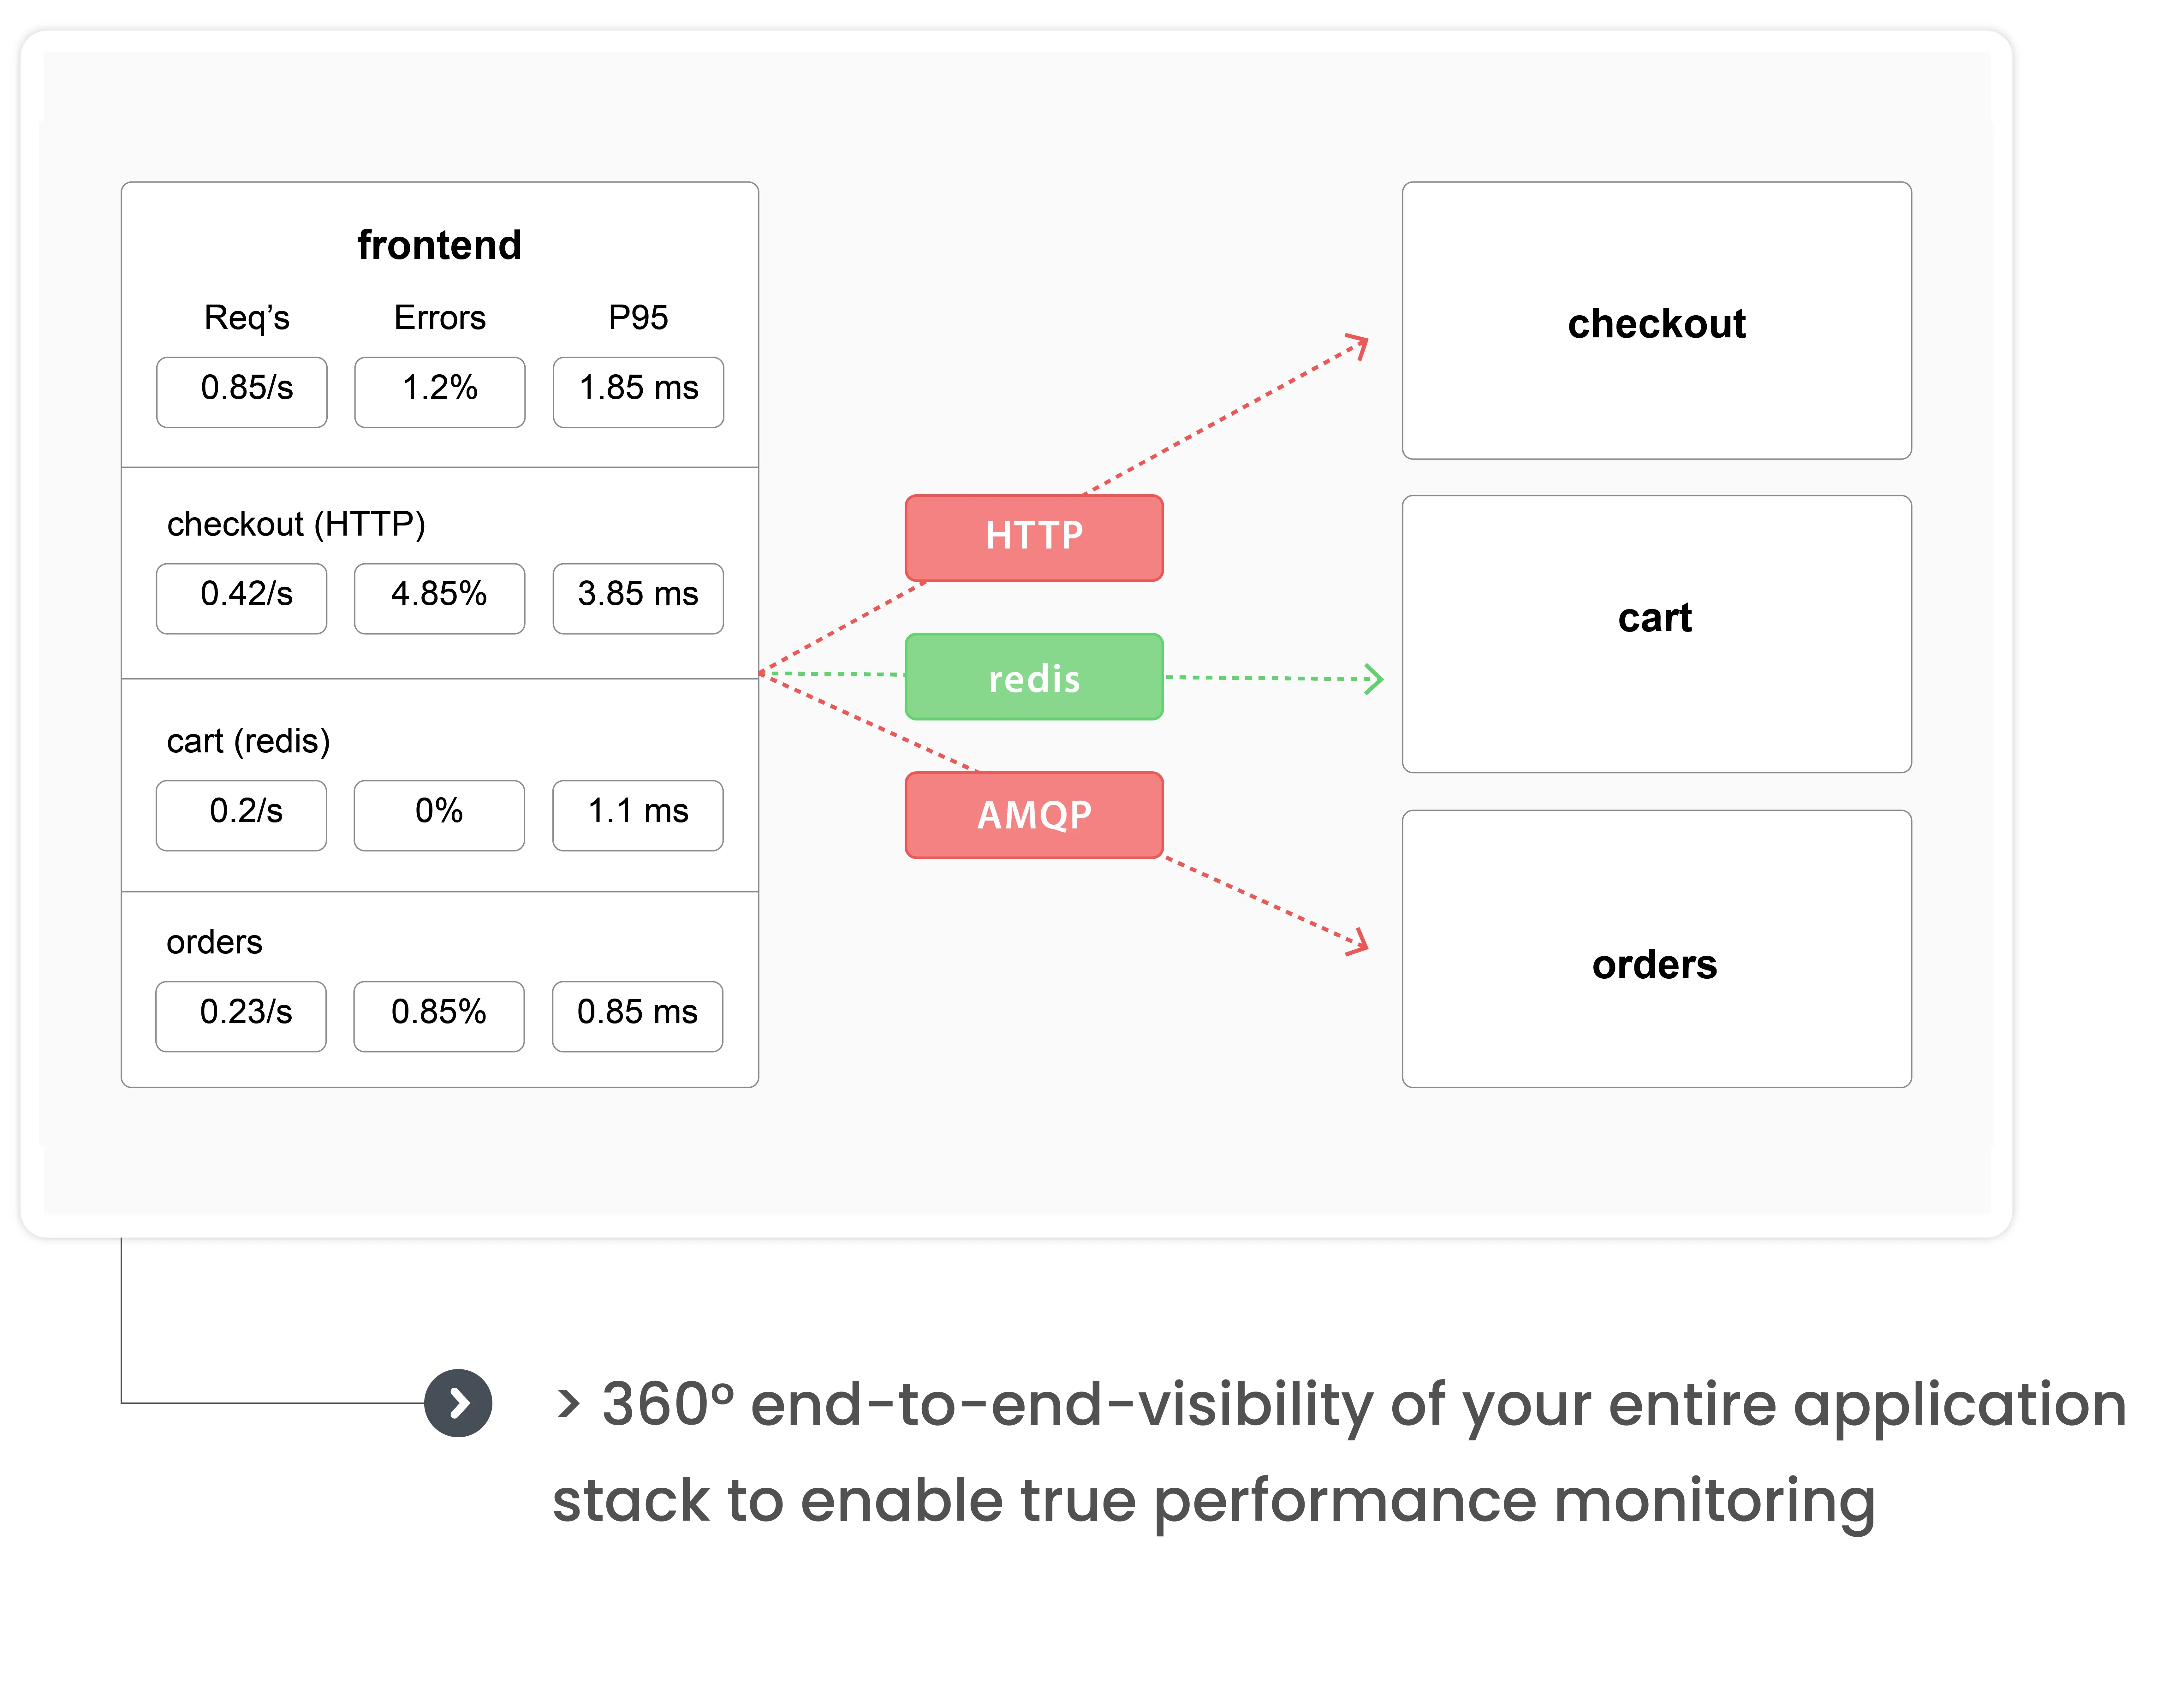
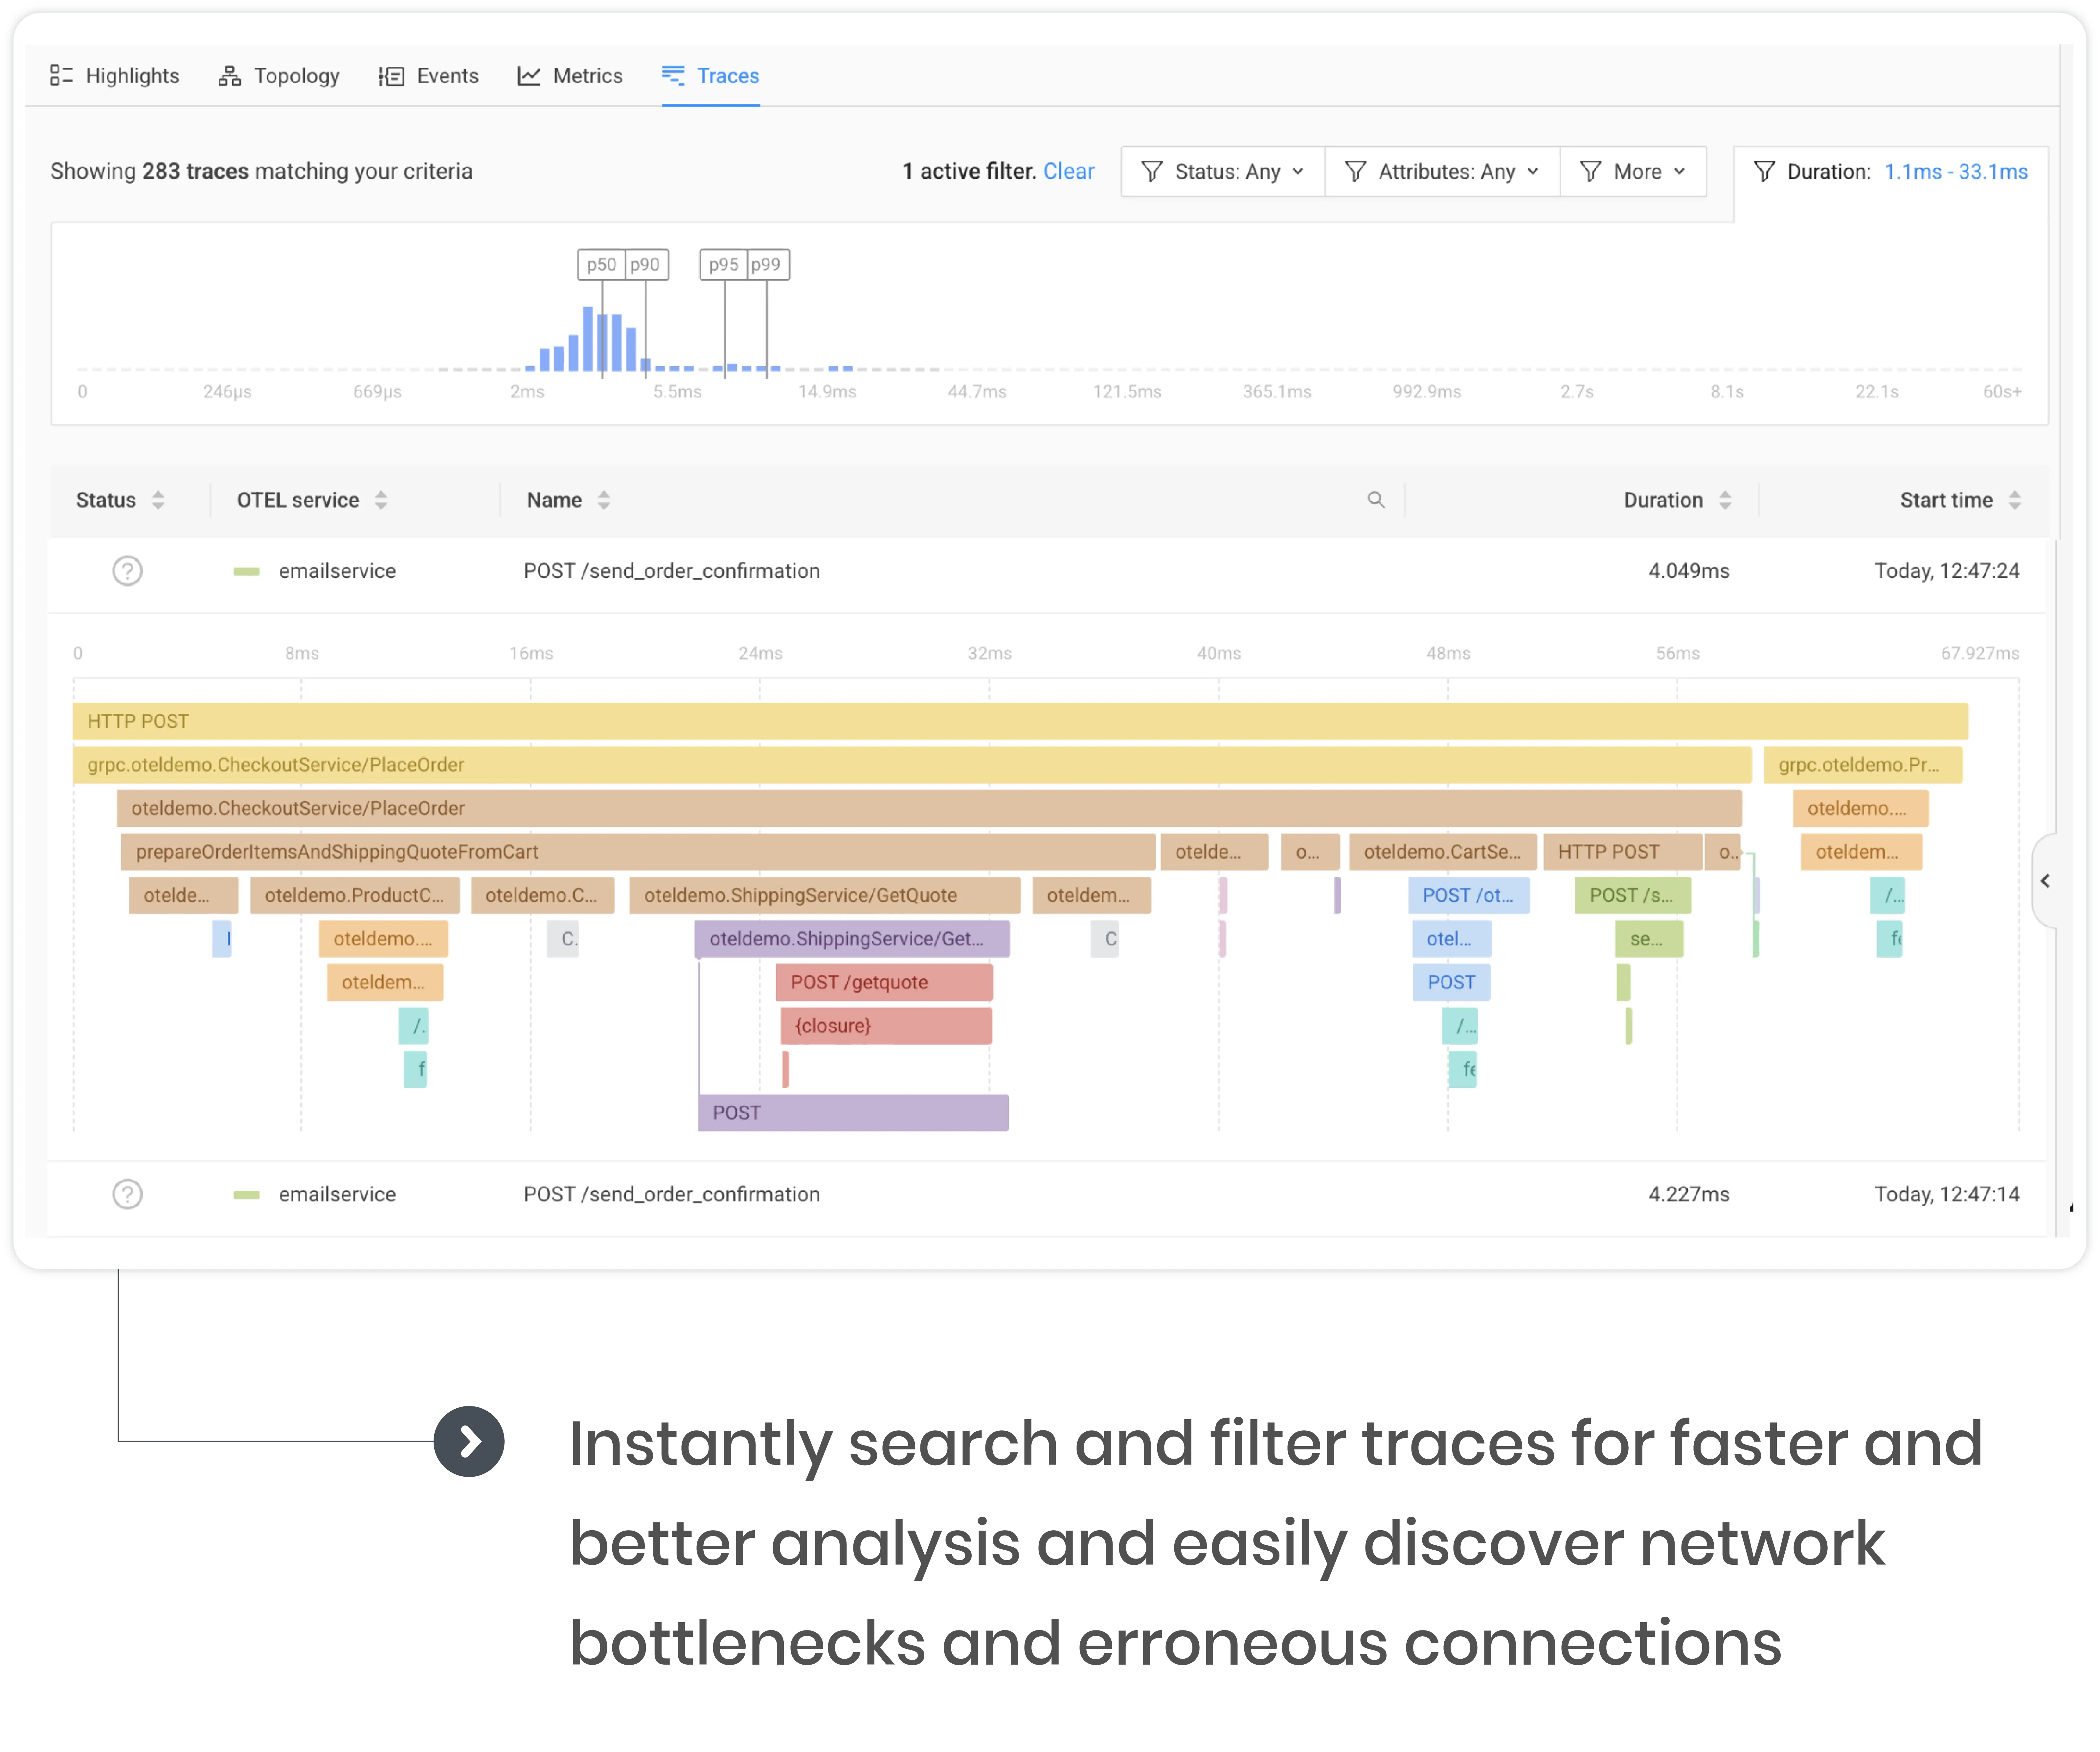
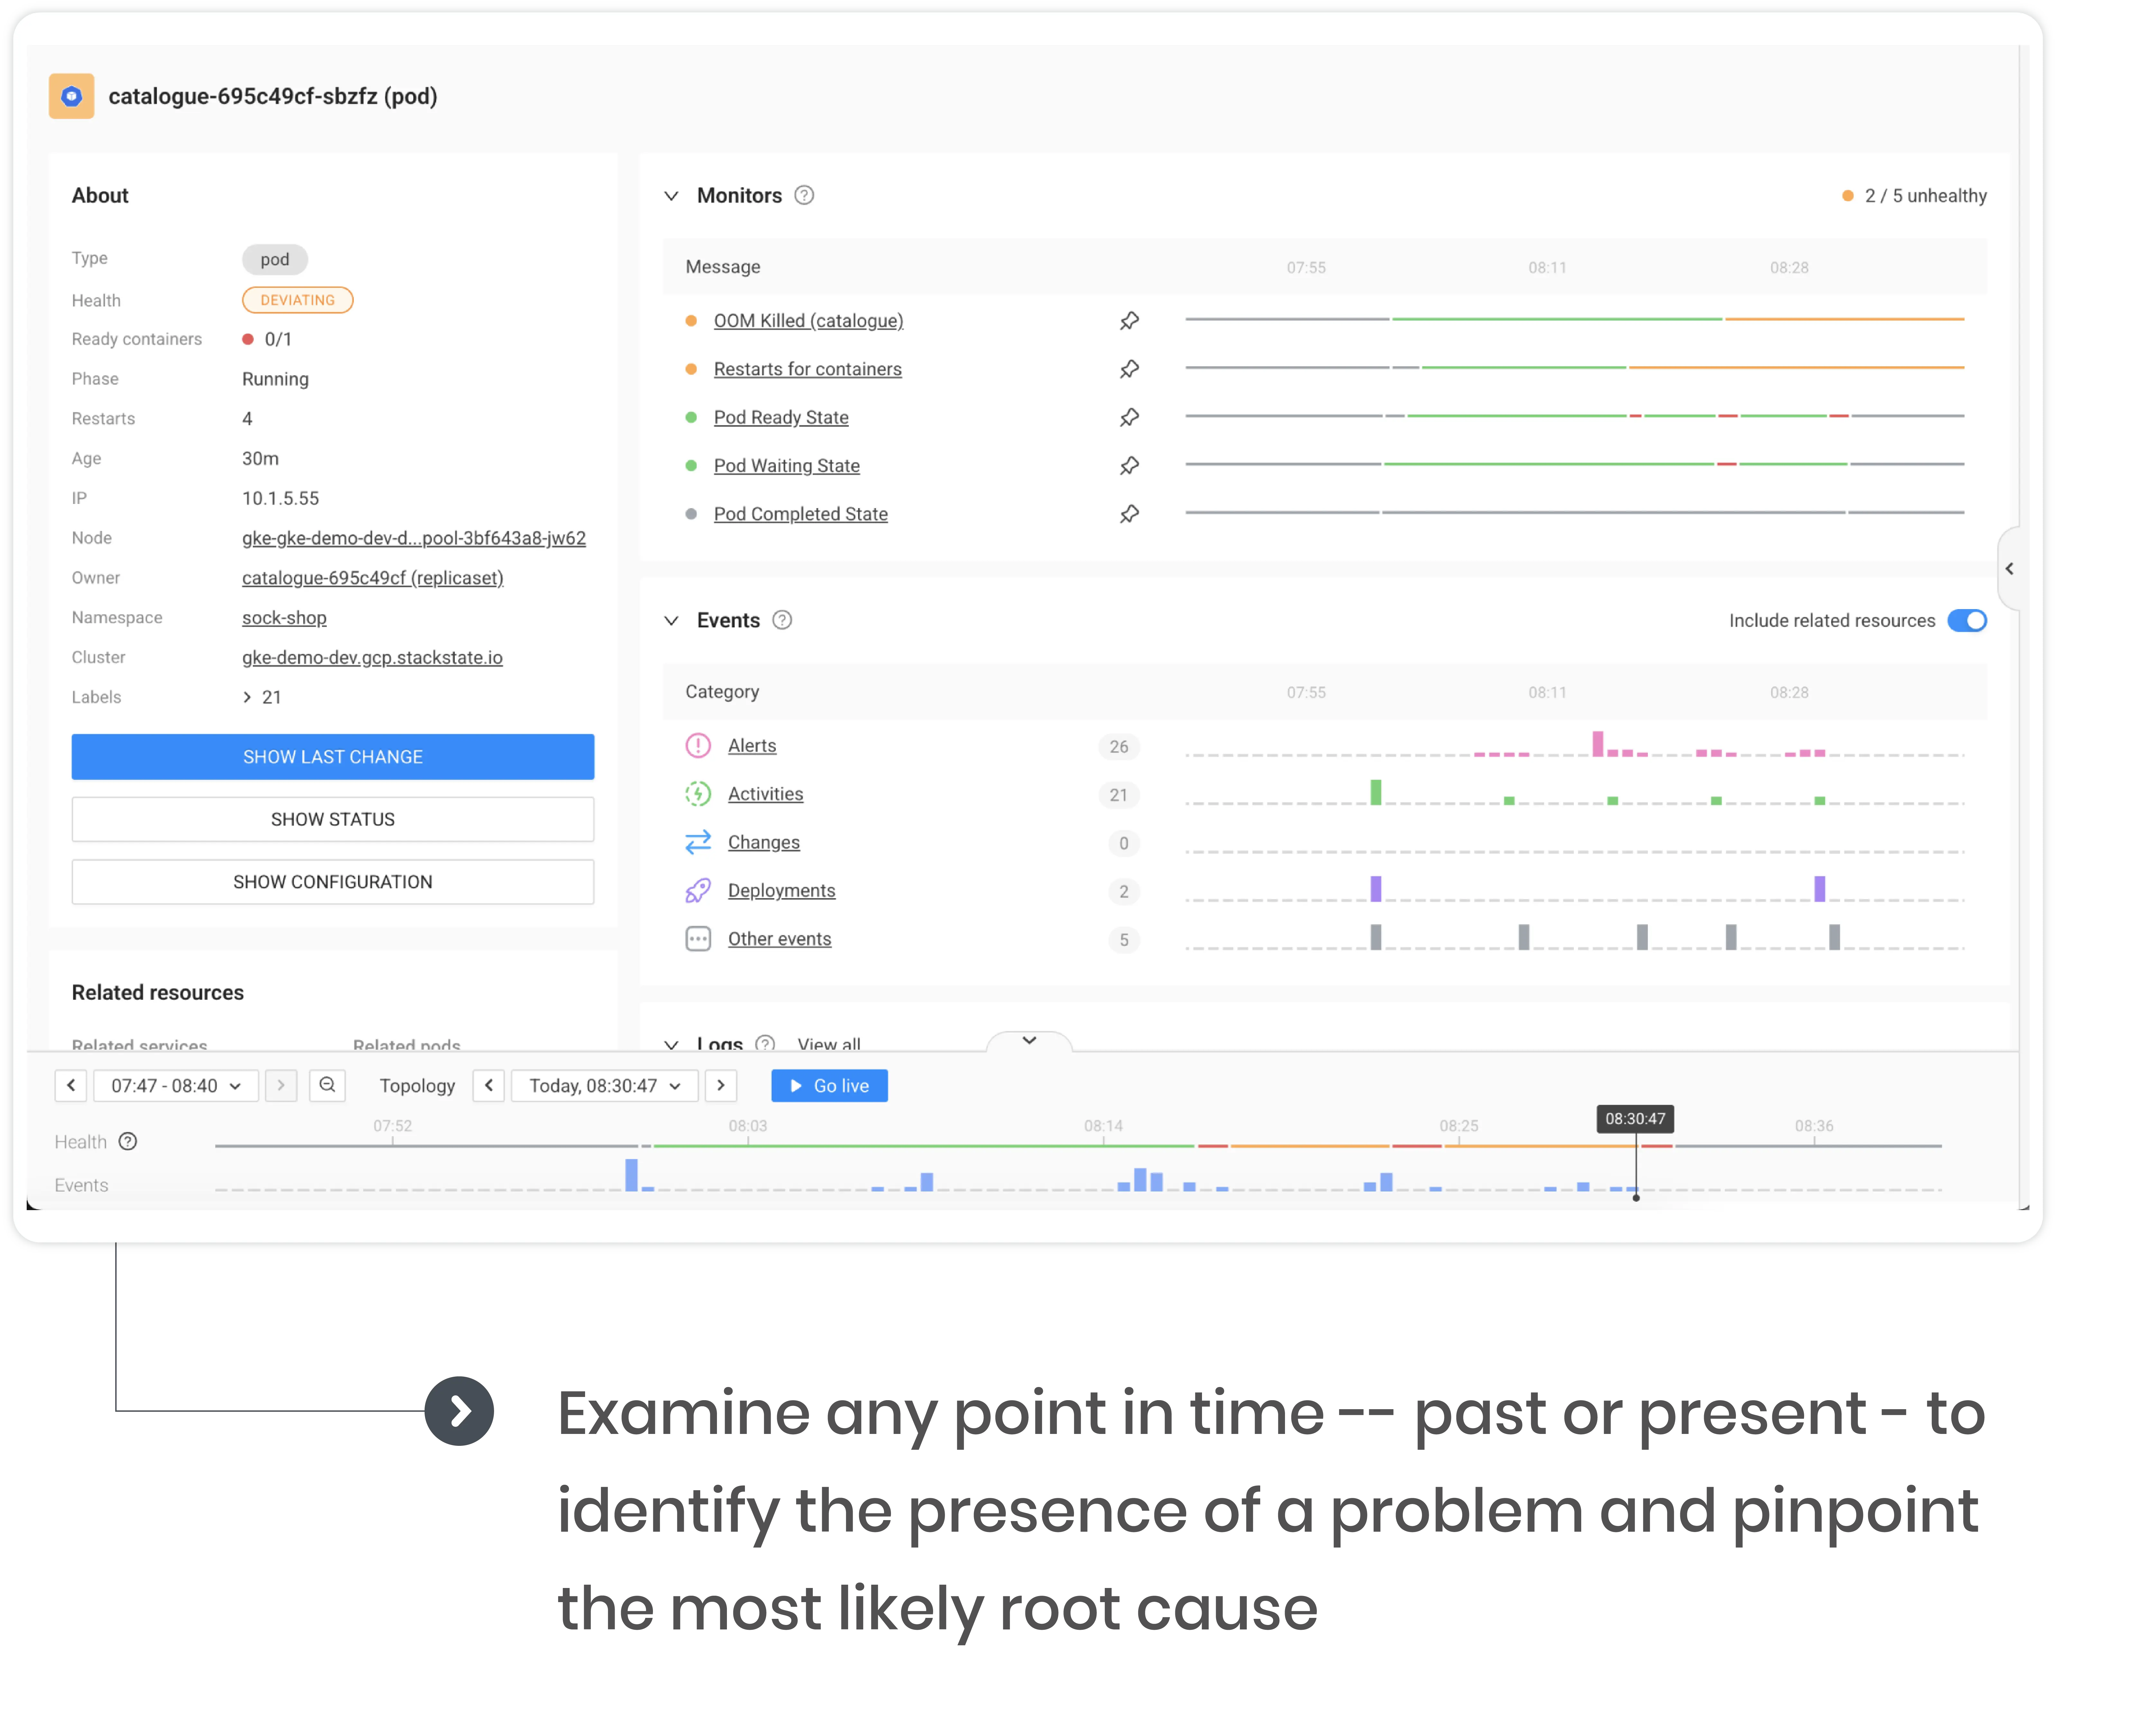
Install in seconds and enjoy complete coverage of application metrics and traces
No need for coding or configuration change in your applications
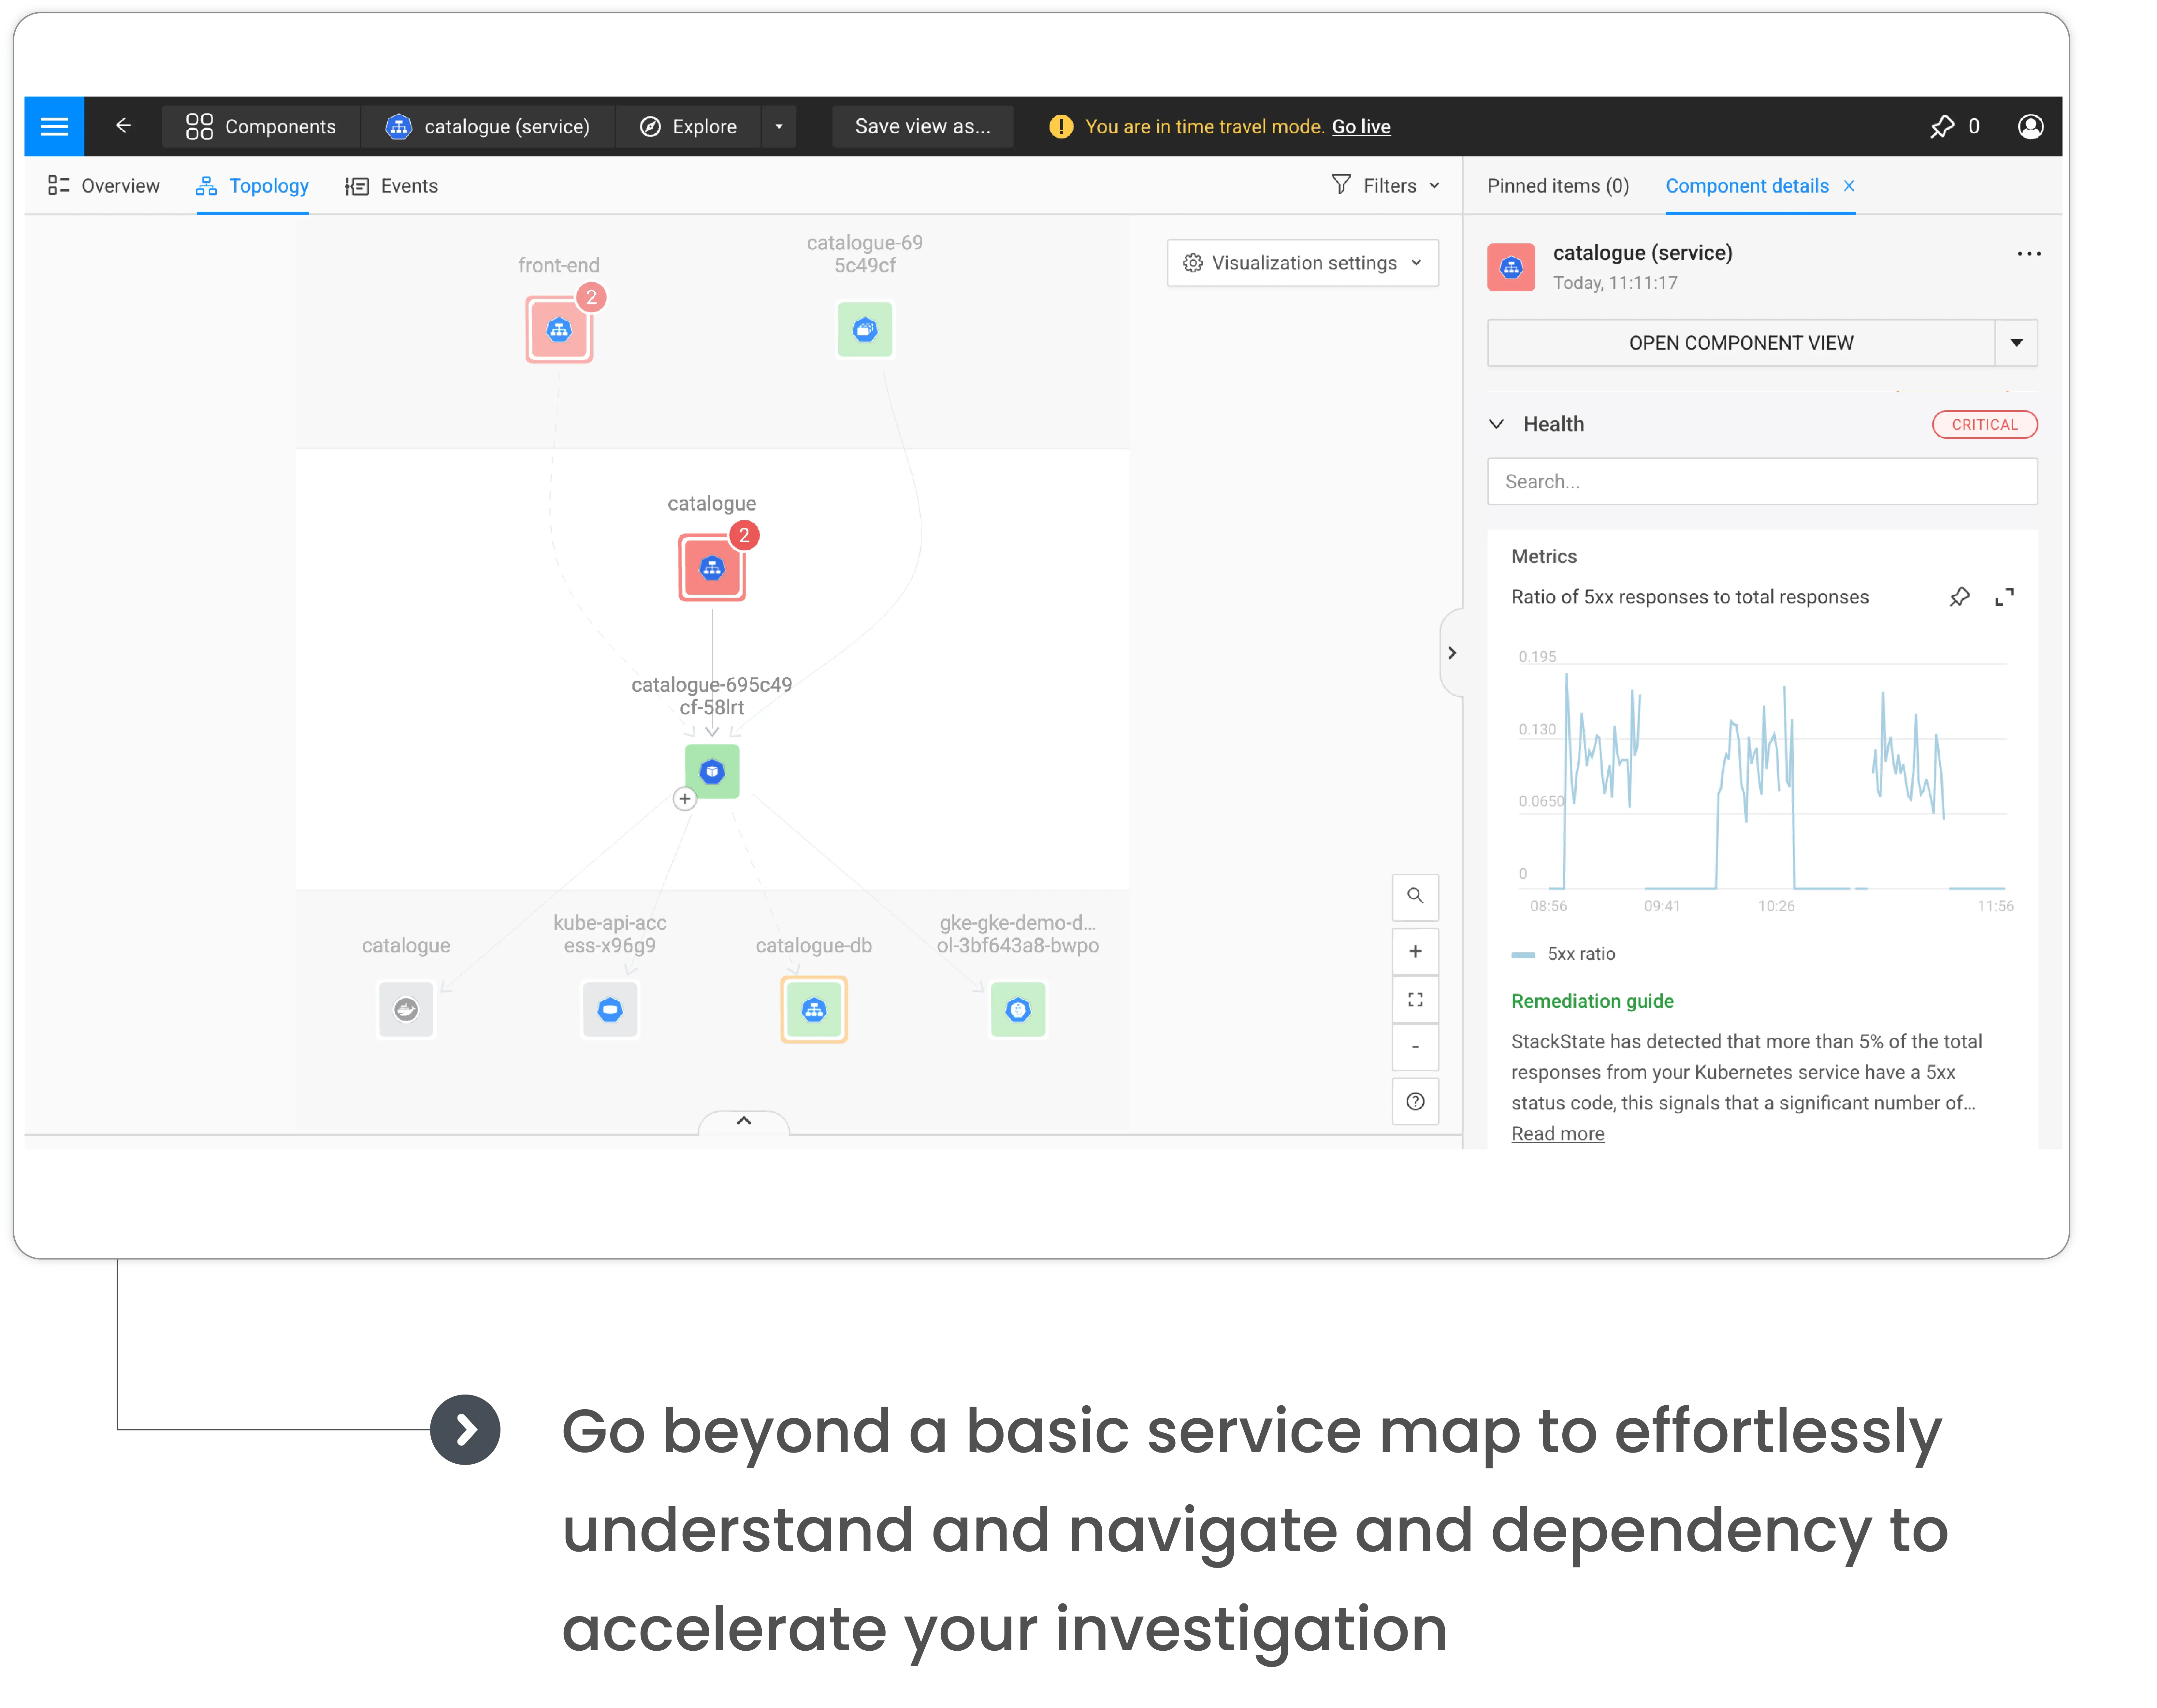
Enhance monitoring by automatically covering your full stack
Correlate new deployments with service performance
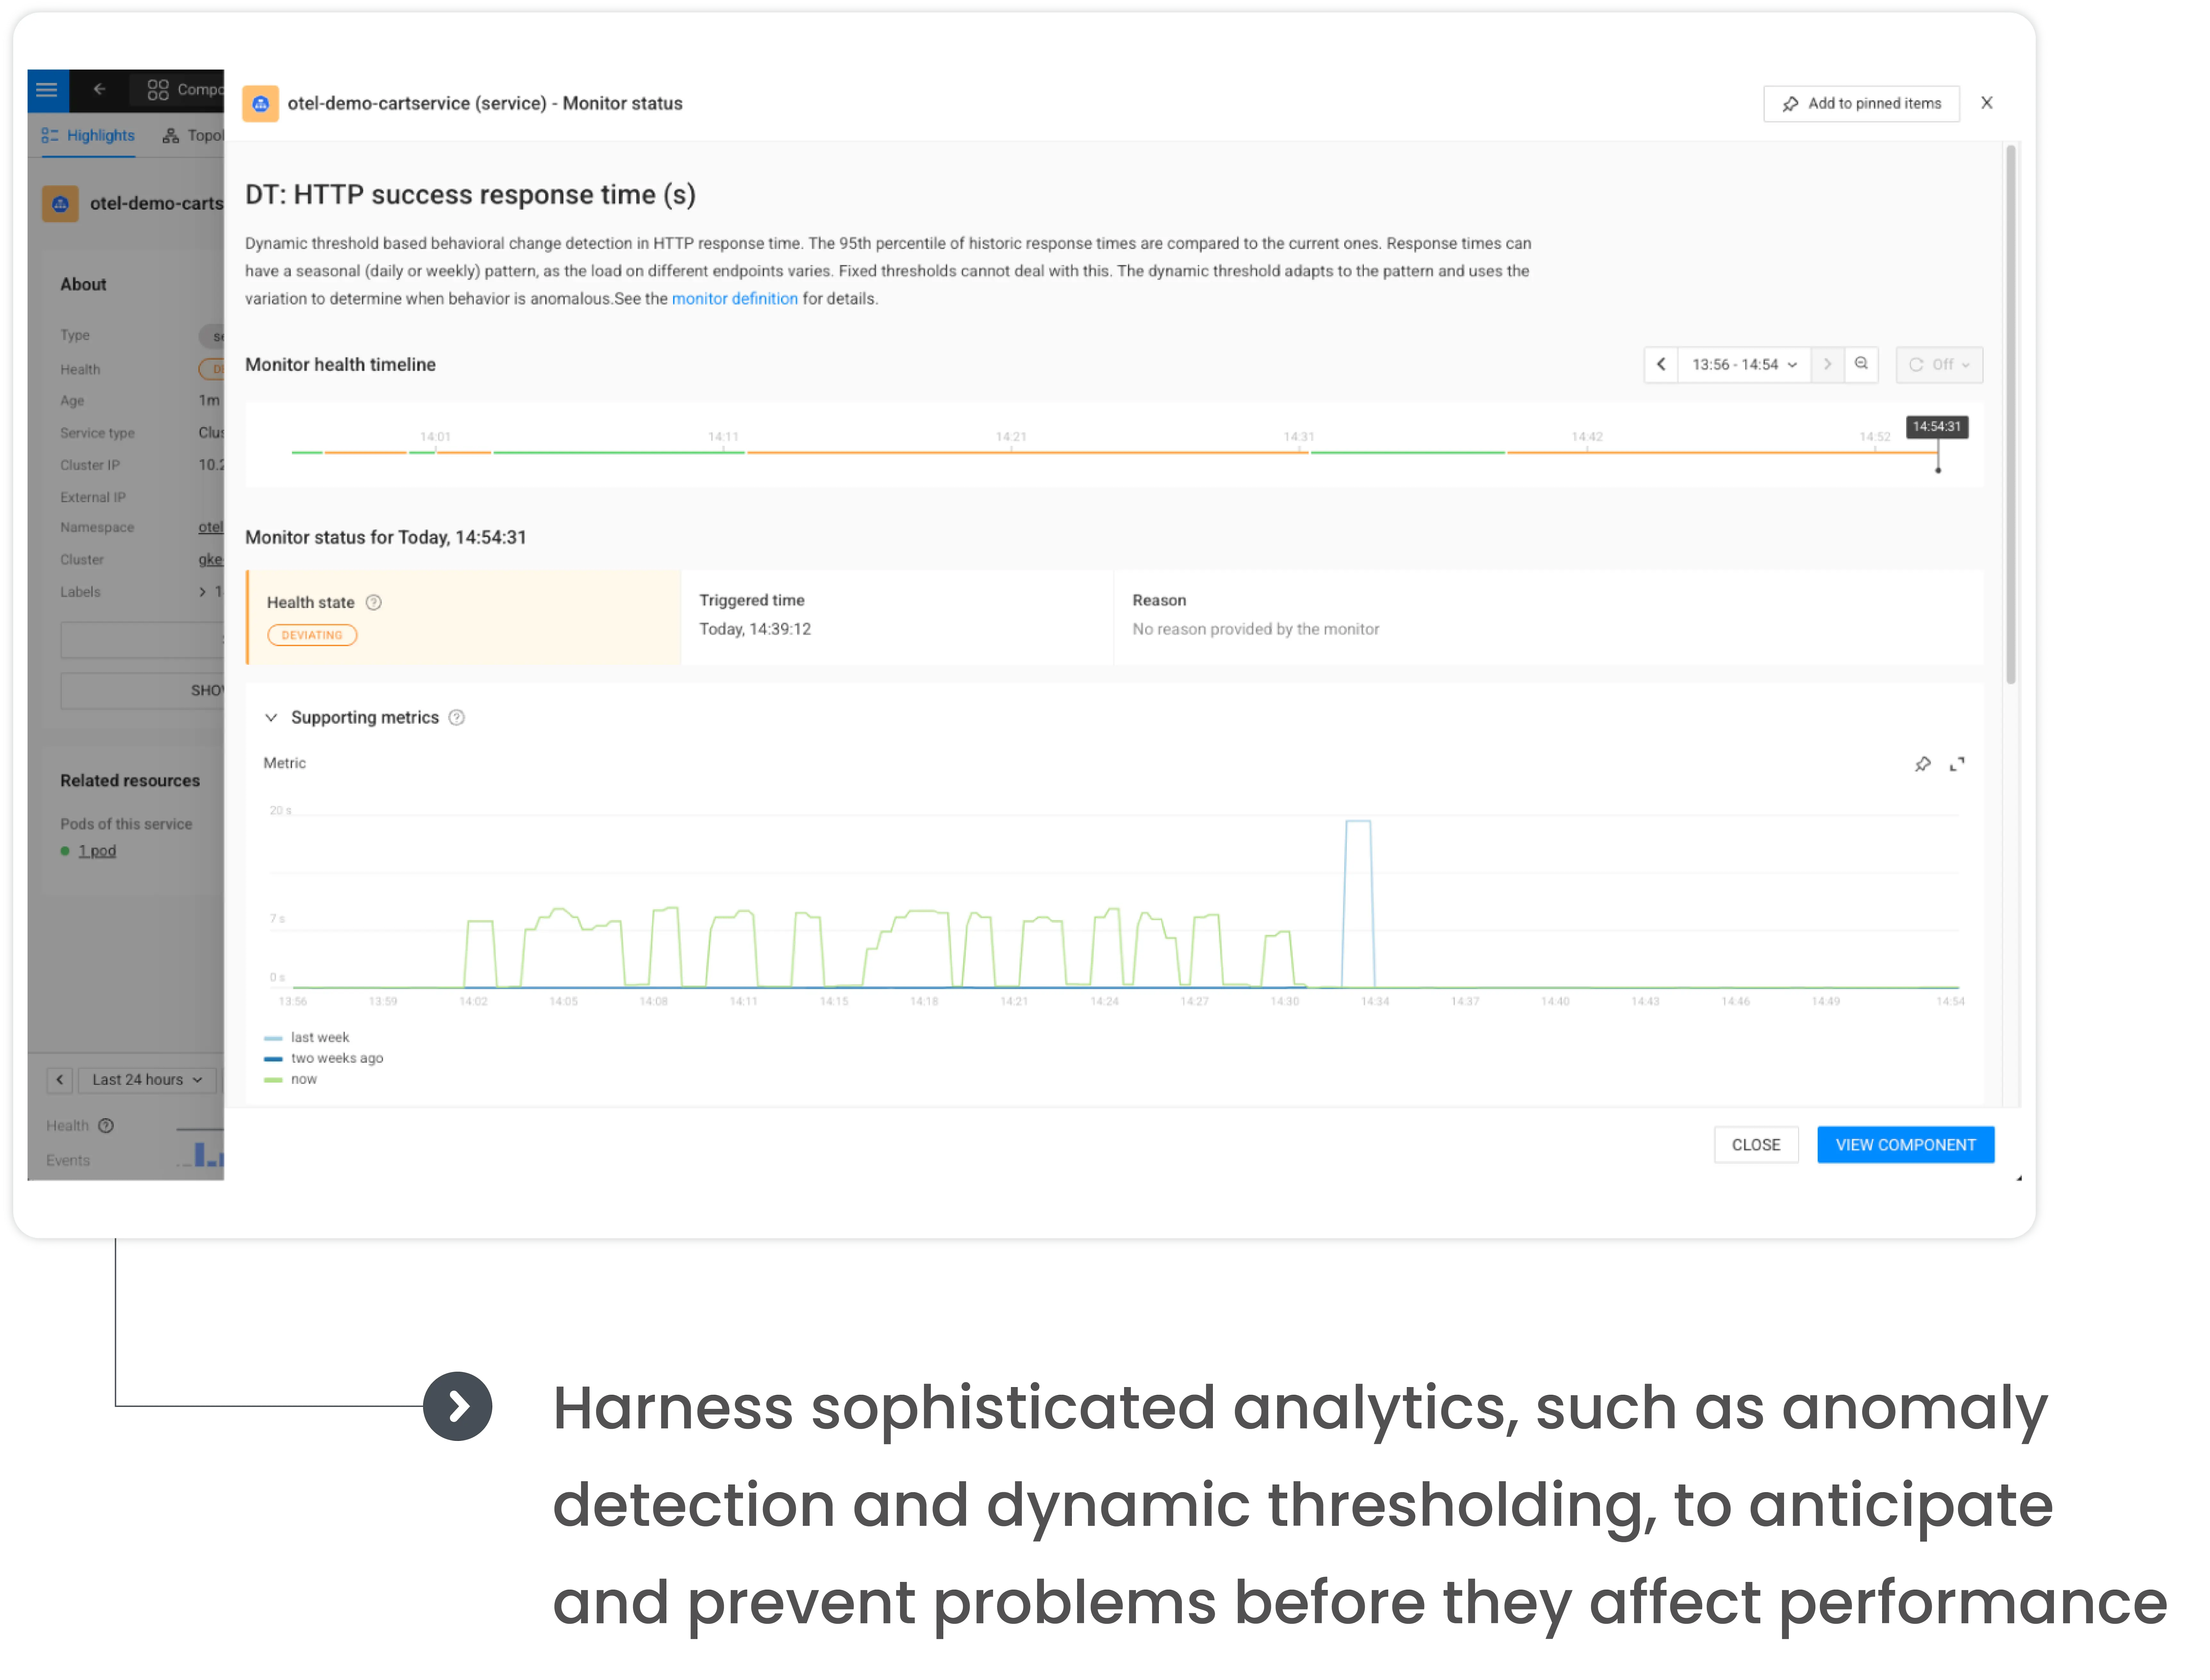
Proactively anticipate performance issues with anomaly detection and dynamic thresholding
Utilize guided remediation to remove data guesswork and increase developer productivity