
What is OpenTelemetry?
The OpenTelemetry project is supported by the Cloud Native Computing Foundation (CNCF), which is one of the largest organizations in the world dedicated to supporting cloud native technologies. OpenTelemetry provides high quality and portable telemetry to enable effective observability for applications written in many different programming languages and frameworks.
The goal of OpenTelemetry is to provide a standard set of libraries and frameworks that can be used across all cloud native environments, including Kubernetes, OpenShift and others. It includes out-of-the-box support for most popular cloud platforms, including Amazon Web Services (AWS), Microsoft Azure and Google Cloud Platform (GCP).
OpenTelemetry brings consistency across tools, teams and vendors. The power of using OpenTelemetry (aka "OTel"), is that any application component can be enriched with metrics, traces and logs that will deliver great insights that go beyond regular monitoring, without the need to build integrations to individual tools. OpenTelemetry can provide deep insights into the relationships between microservices, cloud resources and other components and even gives insights into user experience and business KPIs.
Benefits of using OpenTelemetry
Agnostic across any monitoring solution – OpenTelemetry by itself is not an observability product. It's a flexible framework to instrument application code to collect and send data to multiple participating back-end tools or supported OpenTelemetry collectors. It provides the foundation for IT teams to easily observe system and application behavior, address any performance issues they encounter and use that data to make better decisions about infrastructure.
Observability in the hands of your SREs and DevOps teams – While monitoring is often set up by operations and infrastructure teams, OpenTelemetry provides the ability to put the observability instrumentation into the hands of engineering and development teams. They instrument their code and define what they want to observe; then they can learn about their application and its components live, in production. OpenTelemetry shifts the observability responsibility to the left. OpenTelemetry data gives SREs a great foundation: they can set SLAs and SLIs, and then easily measure performance against these goals to continuously improve.
Early feedback and deeper visibility – OpenTelemetry makes metrics, logs and traces much easier to obtain, which enables early feedback and deeper visibility. No longer do teams need to watch from the sidelines, they can build a deep understanding of component behavior by directly observing a component's inner workings.
Insights into the end customer experience - OpenTelemetry continuously drives the improvement of the end user experience. Think about latency. Very slow response results in a bad customer experience because the request is executed very slowly. This poor performance could result in your customers leaving your application and never coming back.
The Power of Using OpenTelemetry
The StackState full-stack observability platform goes beyond visualizing the data provided by OpenTelemetry. StackState integrates OpenTelemetry data into our powerful 4T Data Model, with the following characteristics:
StackState uses trace data to establish relationships between components and build an enriched, visualized tree of dependencies in your stack. This environment topology provides insights on how components are connected. Particularly in the cloud, container and serverless space, topology is useful because it highlights the volatility of the environment and visualizes changes. We capture not only the current state of your stack (metrics, logs, traces, events, dependencies) but also store this state at every moment in time. You can then use time-traveling topology to go back in time and see what was happening when a problem began. With StackState, you can visualize the changes that led up to an issue over time so you can more easily find and fix the problem.
We also use OpenTelemetry trace data to measure the golden signals of error rate, latency and throughput. These metrics are valuable to understand the performance and health of your system. StackState applies monitors on top of the golden signals to increase control and provide early warnings of potential problems.
Performance optimization is at the heart of our observability platform. Trace data is used to help you truly understand how a customer will experience the performance of your application. With this data, StackState helps you optimize the performance of your services and ultimately improve customer experience.
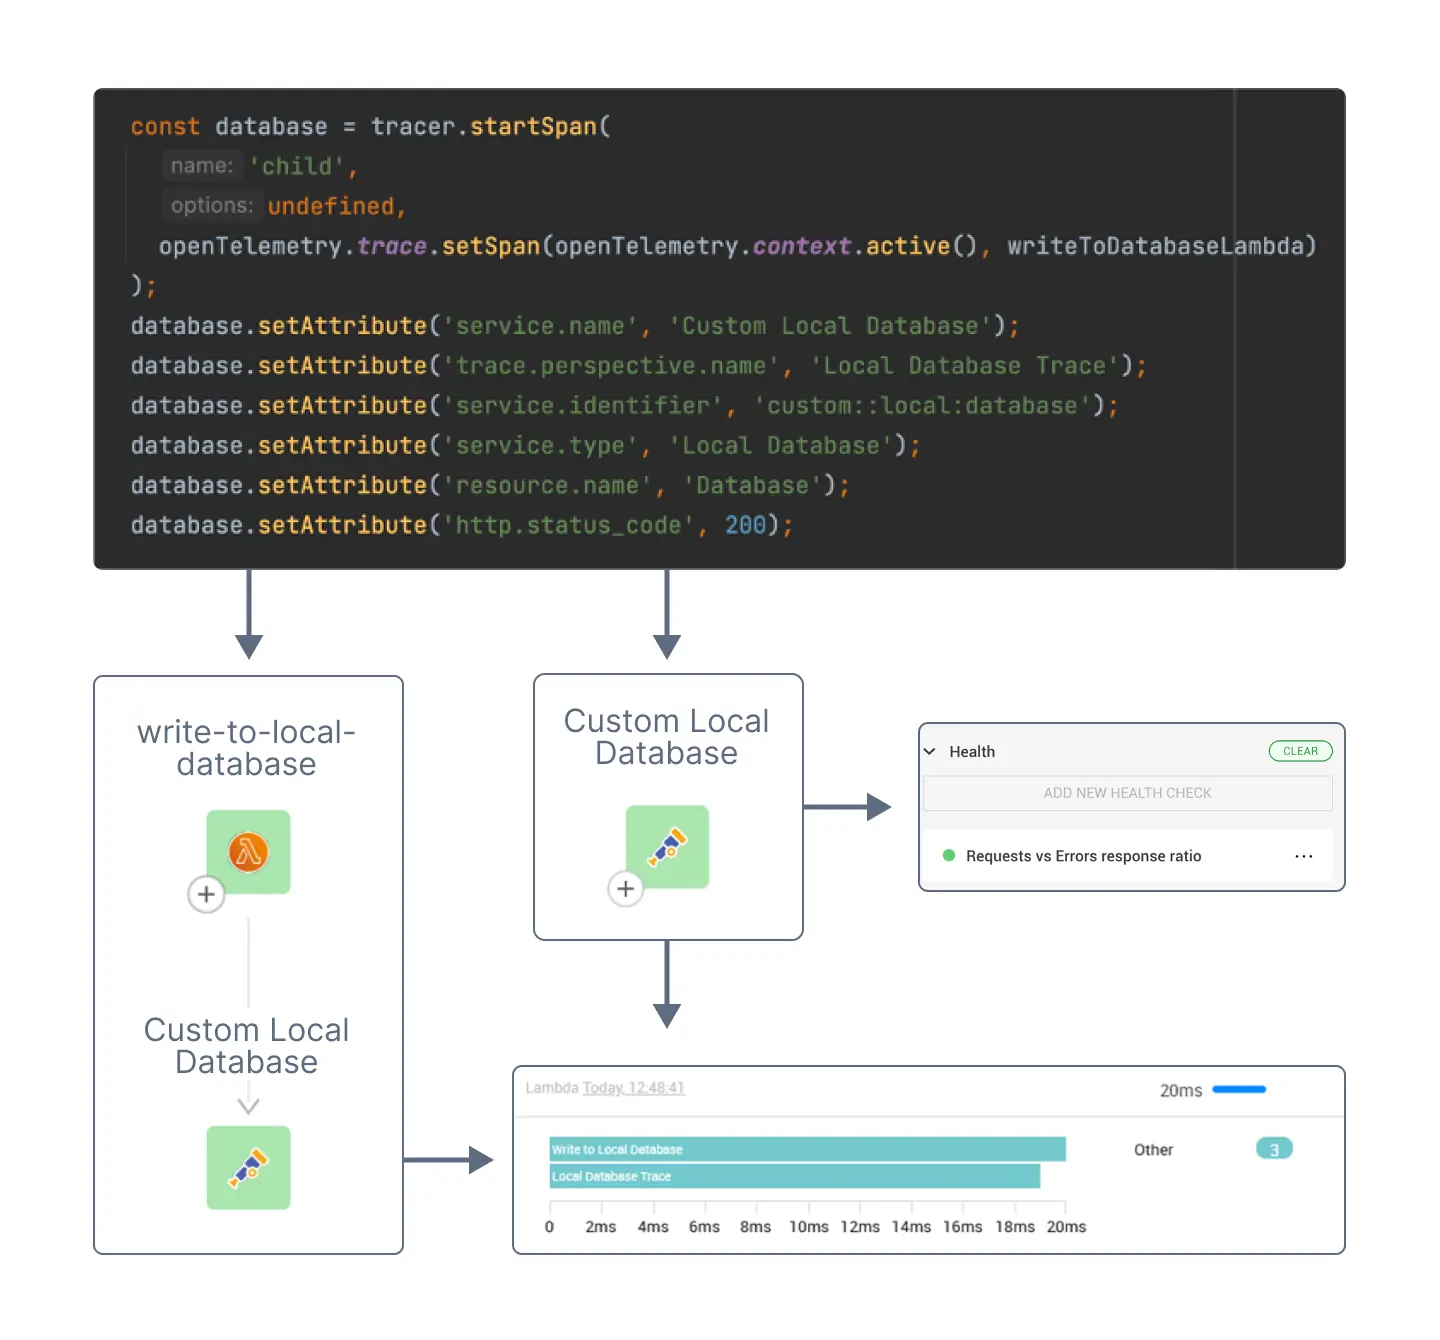
Trace data in the code (top) delivers information on components and dependencies (middle), along with golden signals (bottom right).
Detail on the data OpenTelemetry provides
Telemetry is the collection of data generated by an application, including metrics, logs and (distributed) traces. The OpenTelemetry standard facilitates the collection of this data:
Metrics are the statistics about the availability, performance and capacity of an application.
Logs are records of events that occurred during its operation.
Distributed tracing follows requests as they traverse the application, providing a view of how different services are interacting with each other. OpenTelemetry traces provide the ability to monitor applications built on microservice architecture and allows us to detect bottlenecks and issues that impact an application’s performance.
Learn more about StackState and OpenTelemetry
"How to Use OpenTelemetry to Troubleshoot a Serverless Environment"
– read the blog, watch the videoRead Unified Serverless Observability With OpenTelemetry and StackState v4.6
Listen to the podcast: What Is OpenTelemetry and Is It the Future of Observability
Listen to the podcast: Open Source Observability With Michael Hausenblas of AWS
Explore StackState’s use of OpenTelemetry on our playground .


