
A few days ago, I challenged myself: Could I create a CPU throttling monitor without using StackState's docs page?
I'll go a bit deeper into CPU throttling later, but first: Why this mission? At StackState, we believe that every software developer should be able to observe the health and reliability of their own application — quickly and easily. To manifest this belief, our observability and troubleshooting solution needs to be so simple and intuitive that every developer, platform engineer, and SRE must be able to create their own custom monitors — just as quickly and easily.
Honestly, I have an unfair advantage because I know my way through StackState. On the contrary, I can barely read any code, let alone create a single functioning piece of an application, so don't expect unfair advantages from that side.
But besides challenging myself, I also wanted to dig into why current customers — and individuals we meet during proof-of-concept sessions — feel our UI is so intuitive. That's why today, we're going deeper into the creation of a monitor that detects CPU throttling issues.
What is Kubernetes CPU throttling?
In Kubernetes, CPU throttling is a mechanism to limit the number of CPU resources a container can use per user-defined parameters. This process ensures that one container can't monopolize all the CPU resources on a node. It keeps things balanced and stable for all containers running.
For instance, imagine a container deployed to run a web application. If this container is configured with a limit of 0.5 CPUs but attempts to use more — say during a sudden spike in web traffic — it will be throttled. This ensures that the container doesn't exceed its set limit, even if unused CPU resources are available and idle. While this protects other containers from being starved of resources, it can lead to slower response times and potentially degraded service for the web application.
For example, let's say we allocate 0.2 CPUs to a process that handles web requests. Without any limits, each request might take 1 second to process. However, with the CPU limits in place, each request could potentially take up to 5 seconds to complete. When the process consumes all its allocated resources, it starts throttling. This means it's allowed to use 0.2 seconds of CPU time to perform a task and then wait for the remaining 0.8 seconds before continuing. This cycle repeats until the request is handled. As you can see, this throttling can significantly impact latency.
Throttling is a double-edged sword: it prevents resource hogging but can also inadvertently slow down critical applications if not carefully managed. Understanding and monitoring CPU throttling within Kubernetes is thus crucial for developers and platform engineers to ensure applications run smoothly and efficiently.
Why does Kubernetes CPU throttling matter?
Understanding the significance of CPU throttling in Kubernetes is important for several reasons, as it affects the performance of individual containers as well as the overall health of the cluster.
First, throttled containers can lead to degraded application performance. Since the container cannot access the CPU resources it needs to perform optimally, response times increase, affecting the user experience. This can be particularly detrimental for applications requiring high responsiveness and real-time processing.
Additionally, CPU throttling can cause unpredictable application behavior. Applications designed to scale based on workload might not scale appropriately if throttling prevents them from utilizing the CPU cycles they require to handle increased loads efficiently.
So, what happens?
Degraded Performance: Slower response times and reduced throughput
Increased Latency: Delays in processing requests, impacting user satisfaction
Resource Inefficiency: Poor utilization of available resources, leading to wasted capacity
Operational Complexity: Additional overhead in monitoring and managing resource allocations is required to prevent or mitigate throttling effects
Finally, CPU throttling can impact the overall health of a Kubernetes cluster because when multiple containers are throttled simultaneously, it can lead to resource contention and decrease throughput across the entire system. This degradation in performance can cause cascading failures, affecting not just individual applications but also the stability and reliability of the cluster as a whole.
Understanding the implications of CPU throttling
Being aware of the impact of CPU throttling is crucial for developers, platform engineers, and SREs to ensure that applications remain performant and resources are utilized efficiently. Managing CPU resources effectively helps in avoiding these negative outcomes, ensuring a seamless and responsive user experience.
Let's consider a real-life scenario a leading e-commerce platform faces during its annual sales event.
The platform deployed a microservices architecture running on Kubernetes, with each service scaled to meet the explosive demand.
However, a critical service that is responsible for processing payment transactions began experiencing slow response times, directly impacting customer checkout experiences.
Investigation revealed that this service was hitting its CPU throttling limits frequently, causing significant delays due to insufficient CPU allocation.
By leveraging StackState's CPU Throttling Monitor, the platform's engineering team quickly identified the throttled service. They adjusted the CPU limits based on historical usage patterns and current demand, resolving the latency issues. This immediately restored the checkout process's efficiency, ensuring a smooth customer experience and preventing potential revenue loss during the critical sale period.
Follow these 11 steps to detect CPU throttling in your organization
During my self-challenge, I've devised a straightforward, step-by-step process to assist you in creating your own Kubernetes CPU throttling monitor. To streamline the process further, I've categorized the steps into three stages.
Part A: Fetch a pod-specific CPU Throttling PromQL query
To get started, we’ll first access pod highlights in StackState's main menu. Then, we’ll locate a pre-calculated CPU Throttling metric and expand it to reveal a tailored PromQL query. Let’s go!
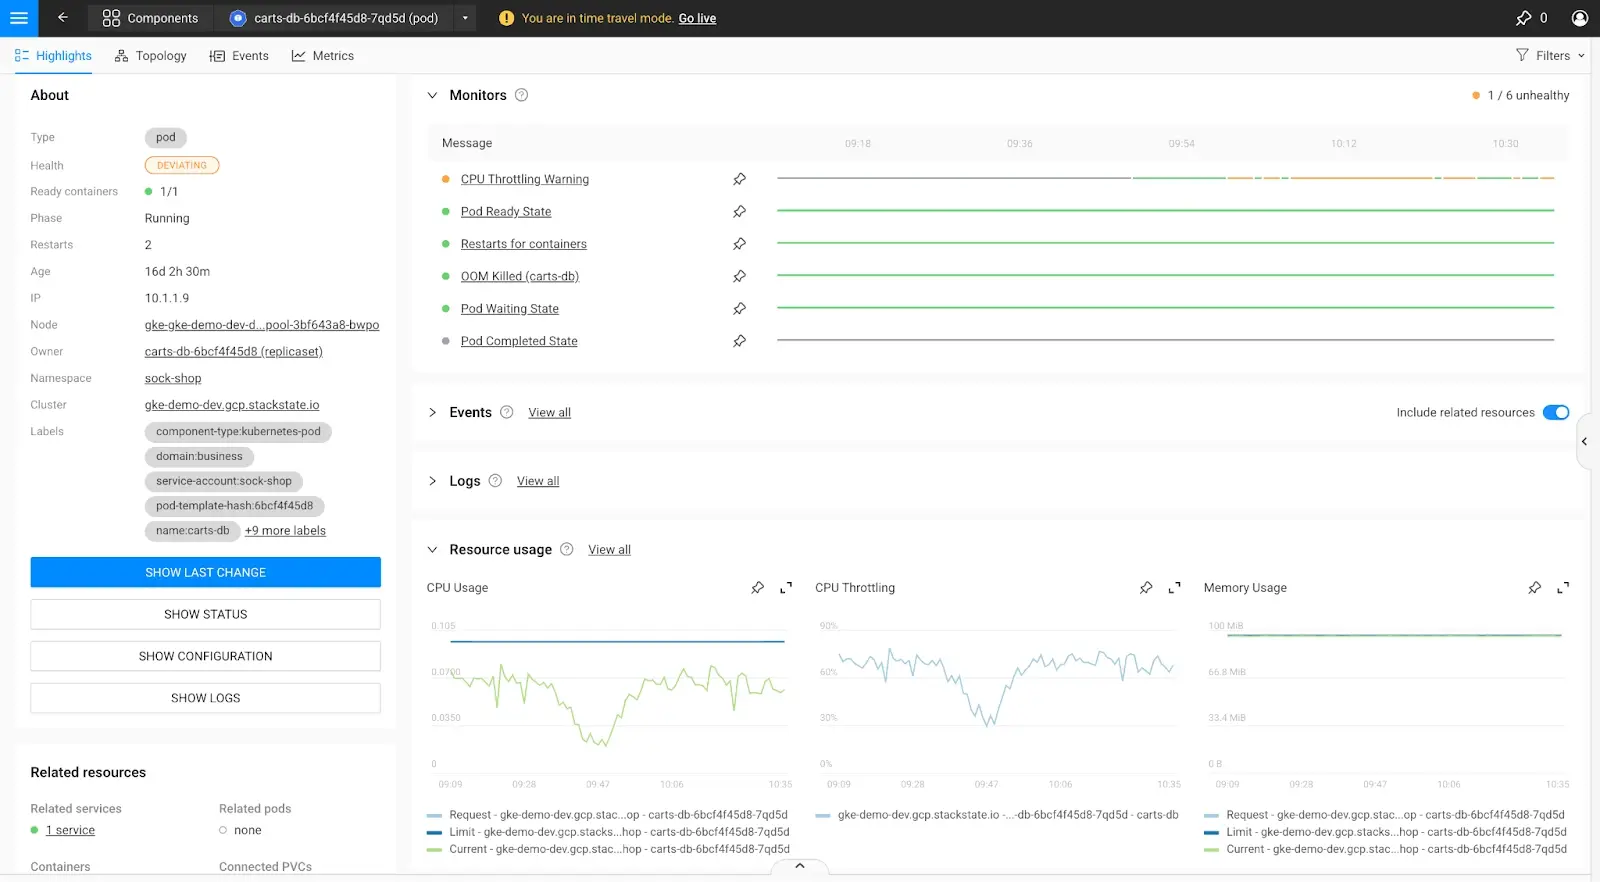
1. Navigate through the StackState main menu to a pod highlight page.
Main Menu > Kubernetes > Pods > Click a particular Pod
2. Scroll down. In the middle of the page, you’ll find the CPU Throttling metric.
We believe that this is such an important metric for your application reliability that StackState ships it out-of-the-box and pre-calculated.
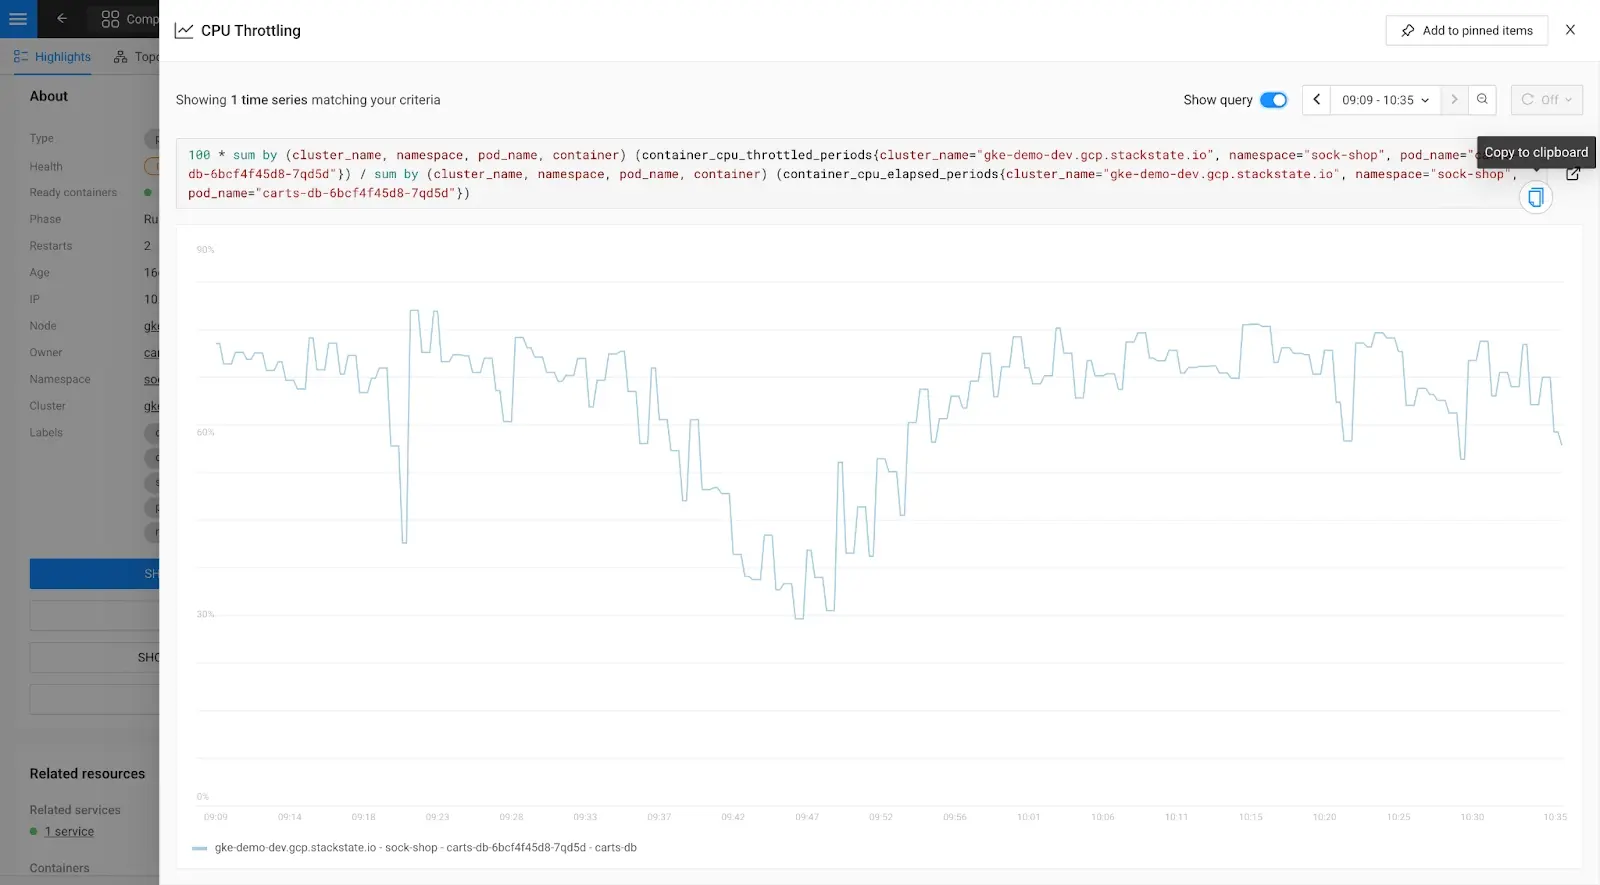
Click the “Expand Metric” icon
3. Fetch the PromQL query by clicking at the top right part of the screen on “Show query.”
A tailored PromQL query will be shown.
Next, click the “Copy to clipboard” icon, which will be shown as you hover over the PromQL query.
Part B: Create a generic CPU throttling monitor
Now that the appropriate PromQL query for CPU Throttling is selected, it's time to create the monitor. A monitor serves as a continuous evaluator, ensuring that specific criteria, such as metric thresholds or service availability configurations, are consistently met. In this instance, we're focusing on creating a metric-based monitor established on metrics collected from the system.
4. Create a monitor by starting the monitor creation flow.
Main menu > Monitors >
Then, click the blue button at the top right, which reads “ADD NEW MONITOR.
5. Click the card “Metric threshold” to create a metric threshold monitor.
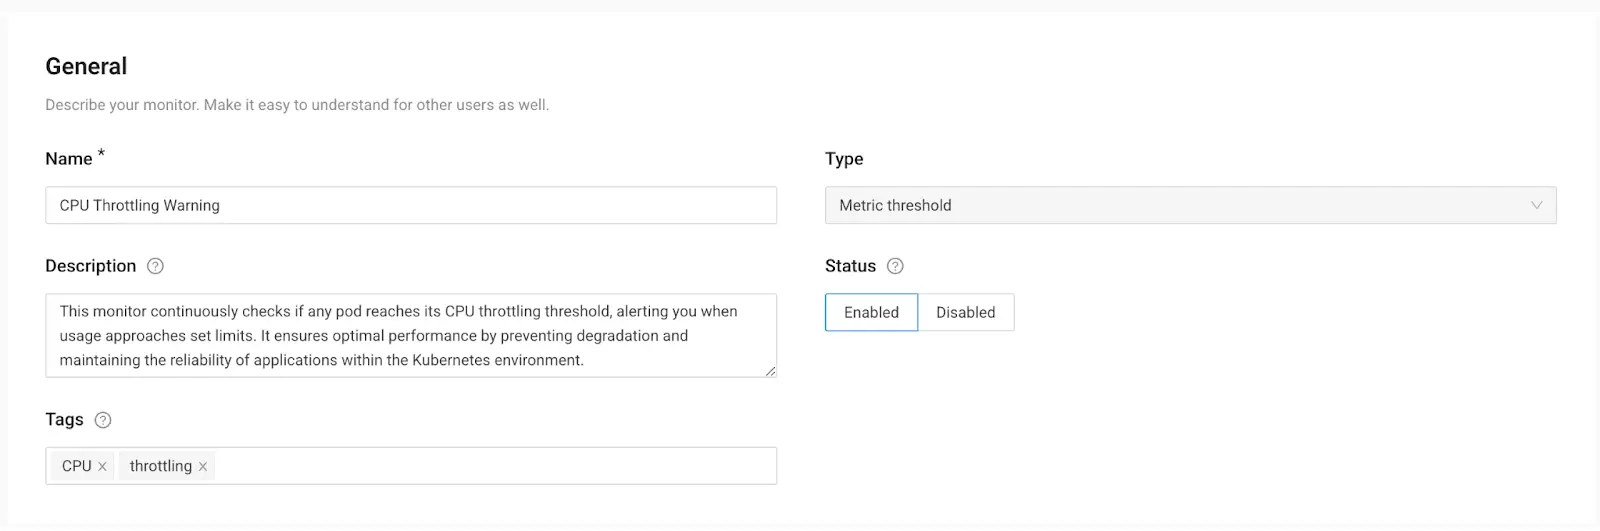
6. Set up the “General Information” for this monitor.
A small description will help the engineer understand what needs to happen.
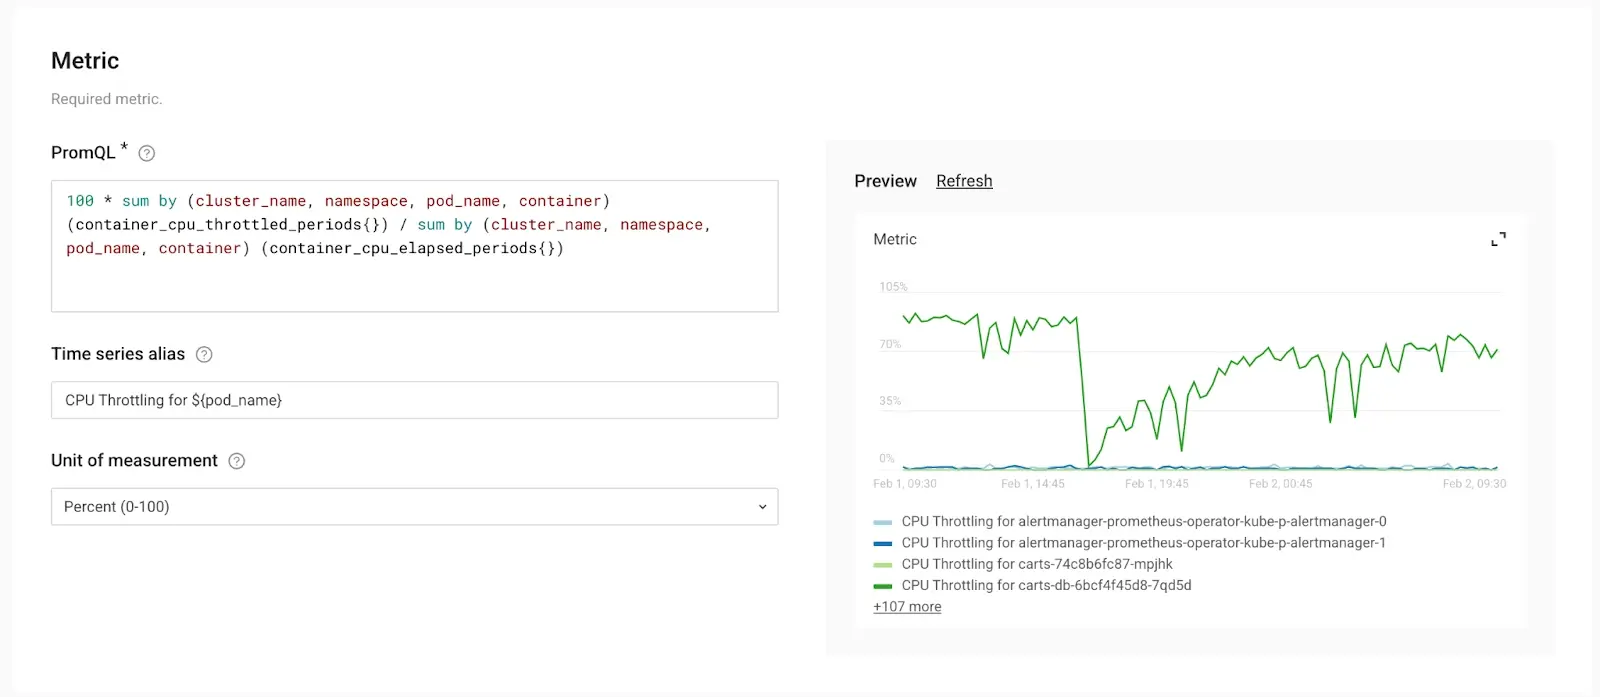
7. Fill in and generalize the metric.
The PromQL query obtained from the specific pod only targets that particular pod. The objective is to generalize the query to make it applicable to all pods across the Kubernetes environment.
Copy/Paste the PromQL query and eliminate any specific references, such as filters targeting individual pods or the pod it was attached to.
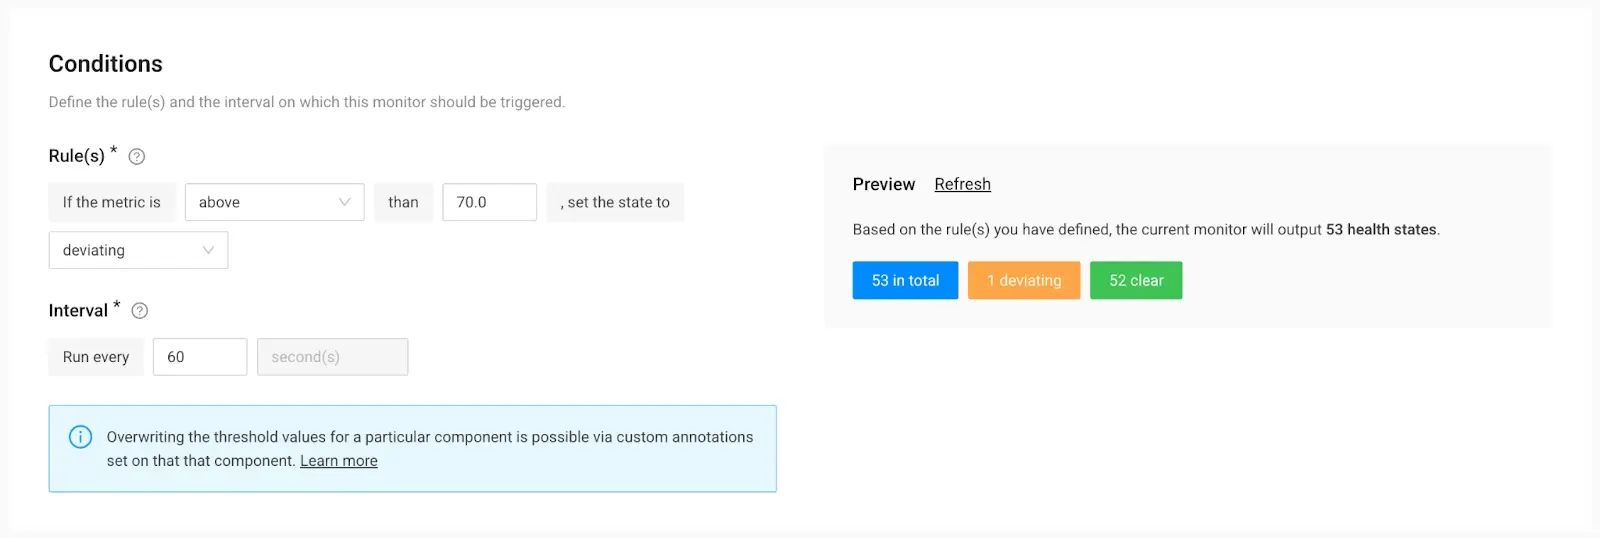
8. Next up is to define the threshold and the interval of validations.
Use the “Conditions” section to set the right threshold.
In the example below, we set the condition of the metric to be “above 70%” and the state of the component to “deviating.”
In the “Preview” section to the right, StackState immediately shows how many resources could be observed with this monitor, how many are in good shape, and how many require attention.
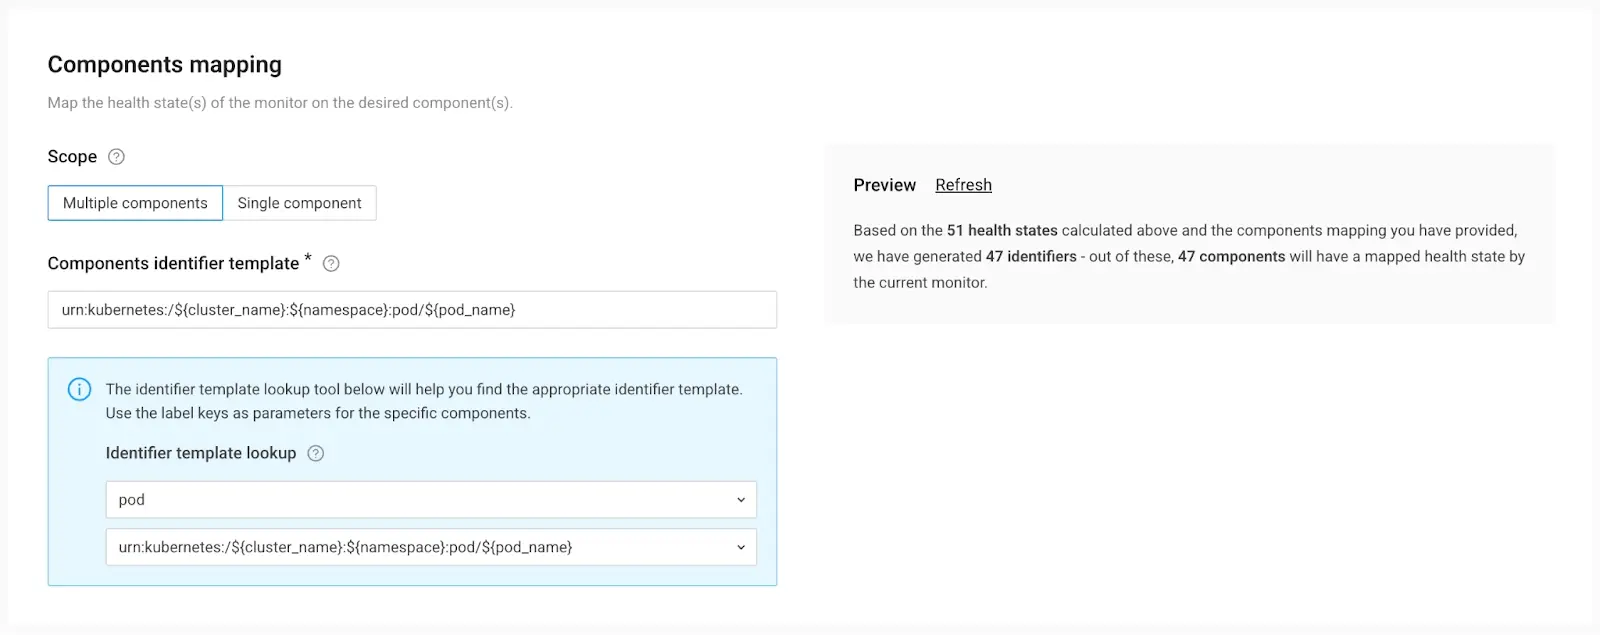
9. With the conditions defined, we need to map the monitor to the right components.
StackState offers an intelligent "Components mapping" feature, allowing you to effortlessly apply this monitor to all pods within your cluster. This functionality is particularly beneficial for platform teams, as it enables them to define the policy once and apply it universally. Even as new workloads are introduced to the cluster, they automatically fall under the same monitoring umbrella. This streamlined approach to scaling simplifies management tasks considerably.
In the “Identifier Template LookUp” tool, we selected “pod” as the resource type, and the correct component identifier template is provided.
In the “Preview” panel review, you’ll see how many components will get an adjusted health state.
Part C: Aid engineering teams addressing similar issues by crafting a Remediation Guide
Ideally, every issue identified in StackState should have its own step-by-step “run book” for efficient resolution. We call these “Remediation Guides,” and they enable your experts — including SREs and Platform Engineers — to share their knowledge and empower development teams to manage their apps independently.
10. Create a Remediation Guide.
In the example shown below, we've provided a basic guide, but the depth of information can vary based on your expertise.
While some practices may be specific to your company, many Kubernetes practices are widely applicable and fairly generic.
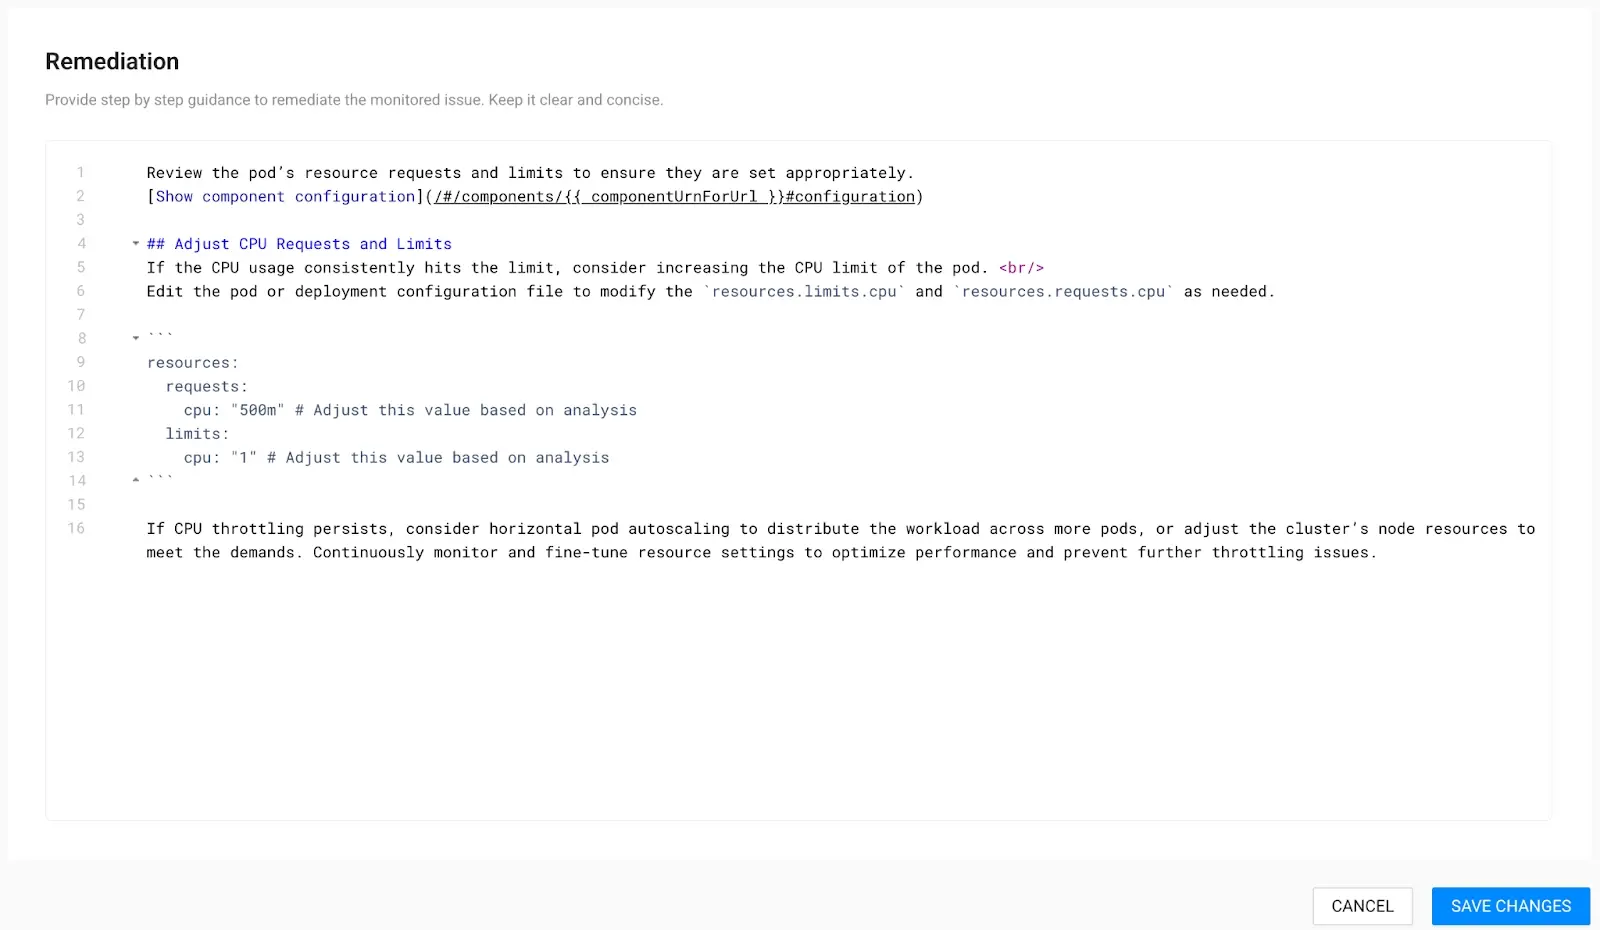
11. The final step is to click “SAVE CHANGES.”
Within just 60 seconds, your newly created monitor will begin reporting any CPU throttling issues, if detected, with a “deviating” state.
Congratulations! You’ve now pushed your reliability to the next level.
Bonus: Setting per-component thresholds
In the above steps we’ve defined a monitor that checks a single threshold for all pods that are running in the cluster. However, maybe not every pod needs to have the exact same threshold defined. With StackState it is possible to have each resource in the cluster define its own custom thresholds for the monitors. This ensures that you don’t need to create tailored monitors per component, but rather define the
monitoring policy just once, ensuring you don’t need to repeat yourself, or create an unwieldy mess.
Defining these custom thresholds is as easy as adding an annotation to your Kubernetes resource. For the monitor we defined above, we could add the following to any Pod to ensure it gets an 80% threshold instead of the standard 70% that the monitor specified.
apiVersion: v1
kind: Pod
metadata:
  annotations:
    monitor.custom.stackstate.io/pod-throttling-warning: |-
      {
        “threshold”: 80.0
      }
Using these annotations, you can make your thresholds part of your CI pipeline and automatically alert on the right.
Accomplish your reliability mission with StackState
StackState simplifies your reliability efforts by offering out-of-the-box monitors and comprehensive Remediation Guides that are ready to use. Our platform empowers developers, platform engineers, and SREs with pre-curated metrics for instant observability and monitoring. With an intuitive interface and automatic application of monitors across clusters, operational efficiency is improved, ensuring consistent monitoring of new workloads.
Above all, StackState provides engineering teams with quick insights to identify and solve issues, boosting application reliability. Our commitment to a comprehensive, user-friendly observability solution supports your team in focusing on innovation.
Feel free to check out our open playground to see how monitors can be used. One note: adjusting and adding new monitors is disabled on our playground. This works best with your own data in our free trial version of StackState.
But wait, I must confess that I had a little help:
Just to be very open and transparent, I had a little help along the way.
In step 7, the pod-specific PromQL Query was adjusted to be more generic and applicable to all pods in the cluster. However, due to my limited coding knowledge, I struggled to generalize it accurately for all pods.
Also, in the creation of a remediation guide, I didn't thoroughly document deep links to essential information, such as resource configurations. Fortunately, one of our product managers assisted in navigating to the relevant deep links. It pays to have a great team!
One final note
Due to the significant importance of Kubernetes CPU Throttling, we've included this monitor right out of the box. All you need to do is adjust the thresholds using the appropriate annotations, so you can easily tune it on a per-pod basis.
Watch this video for a step-by-step guide on how to do so.


