Spoiler Alert: You can also watch a demo video here.
Losing track of communication between applications or code has become a problem with the tech world growing more into supporting Serverless cloud architectures and allowing the developer to maintain, upgrade and update these services.
One might say that services and code are becoming more loosely coupled, allowing code to run and execute in silos. Let's take an AWS Lambda function as an example. Suppose an error occurs during an execution cycle where your code was supposed to communicate with another service in the architecture; the only way you can know about this is to go into the logs for this function and explicitly look for errors. To put a cherry on top of this, if the developer decided to gracefully and safely catch the error and not log anything, it is virtually impossible to know if the script failed or succeeded by looking at the code execution logs. We then need to jump into other services it was communicating with, which creates one massive headache, especially if you do not know the architecture.
So all in all, the crazy spaghetti can get humongous, with incorrect logging, horrible management of errors, and even core members leaving the company without the correct knowledge transfer of volatile or sensitive services.
With that being said, OpenTelemetry, the knight in shining armor, allowed me to solve the problems mentioned above. For the example I'll be using, I will focus on AWS NodeJS Lambda functions (Currently supported by StackState) that will be communicating with a handful of AWS services and the StackState Platform.
Developing a Serverless application
Our example
Let's take this super basic Serverless AWS example.
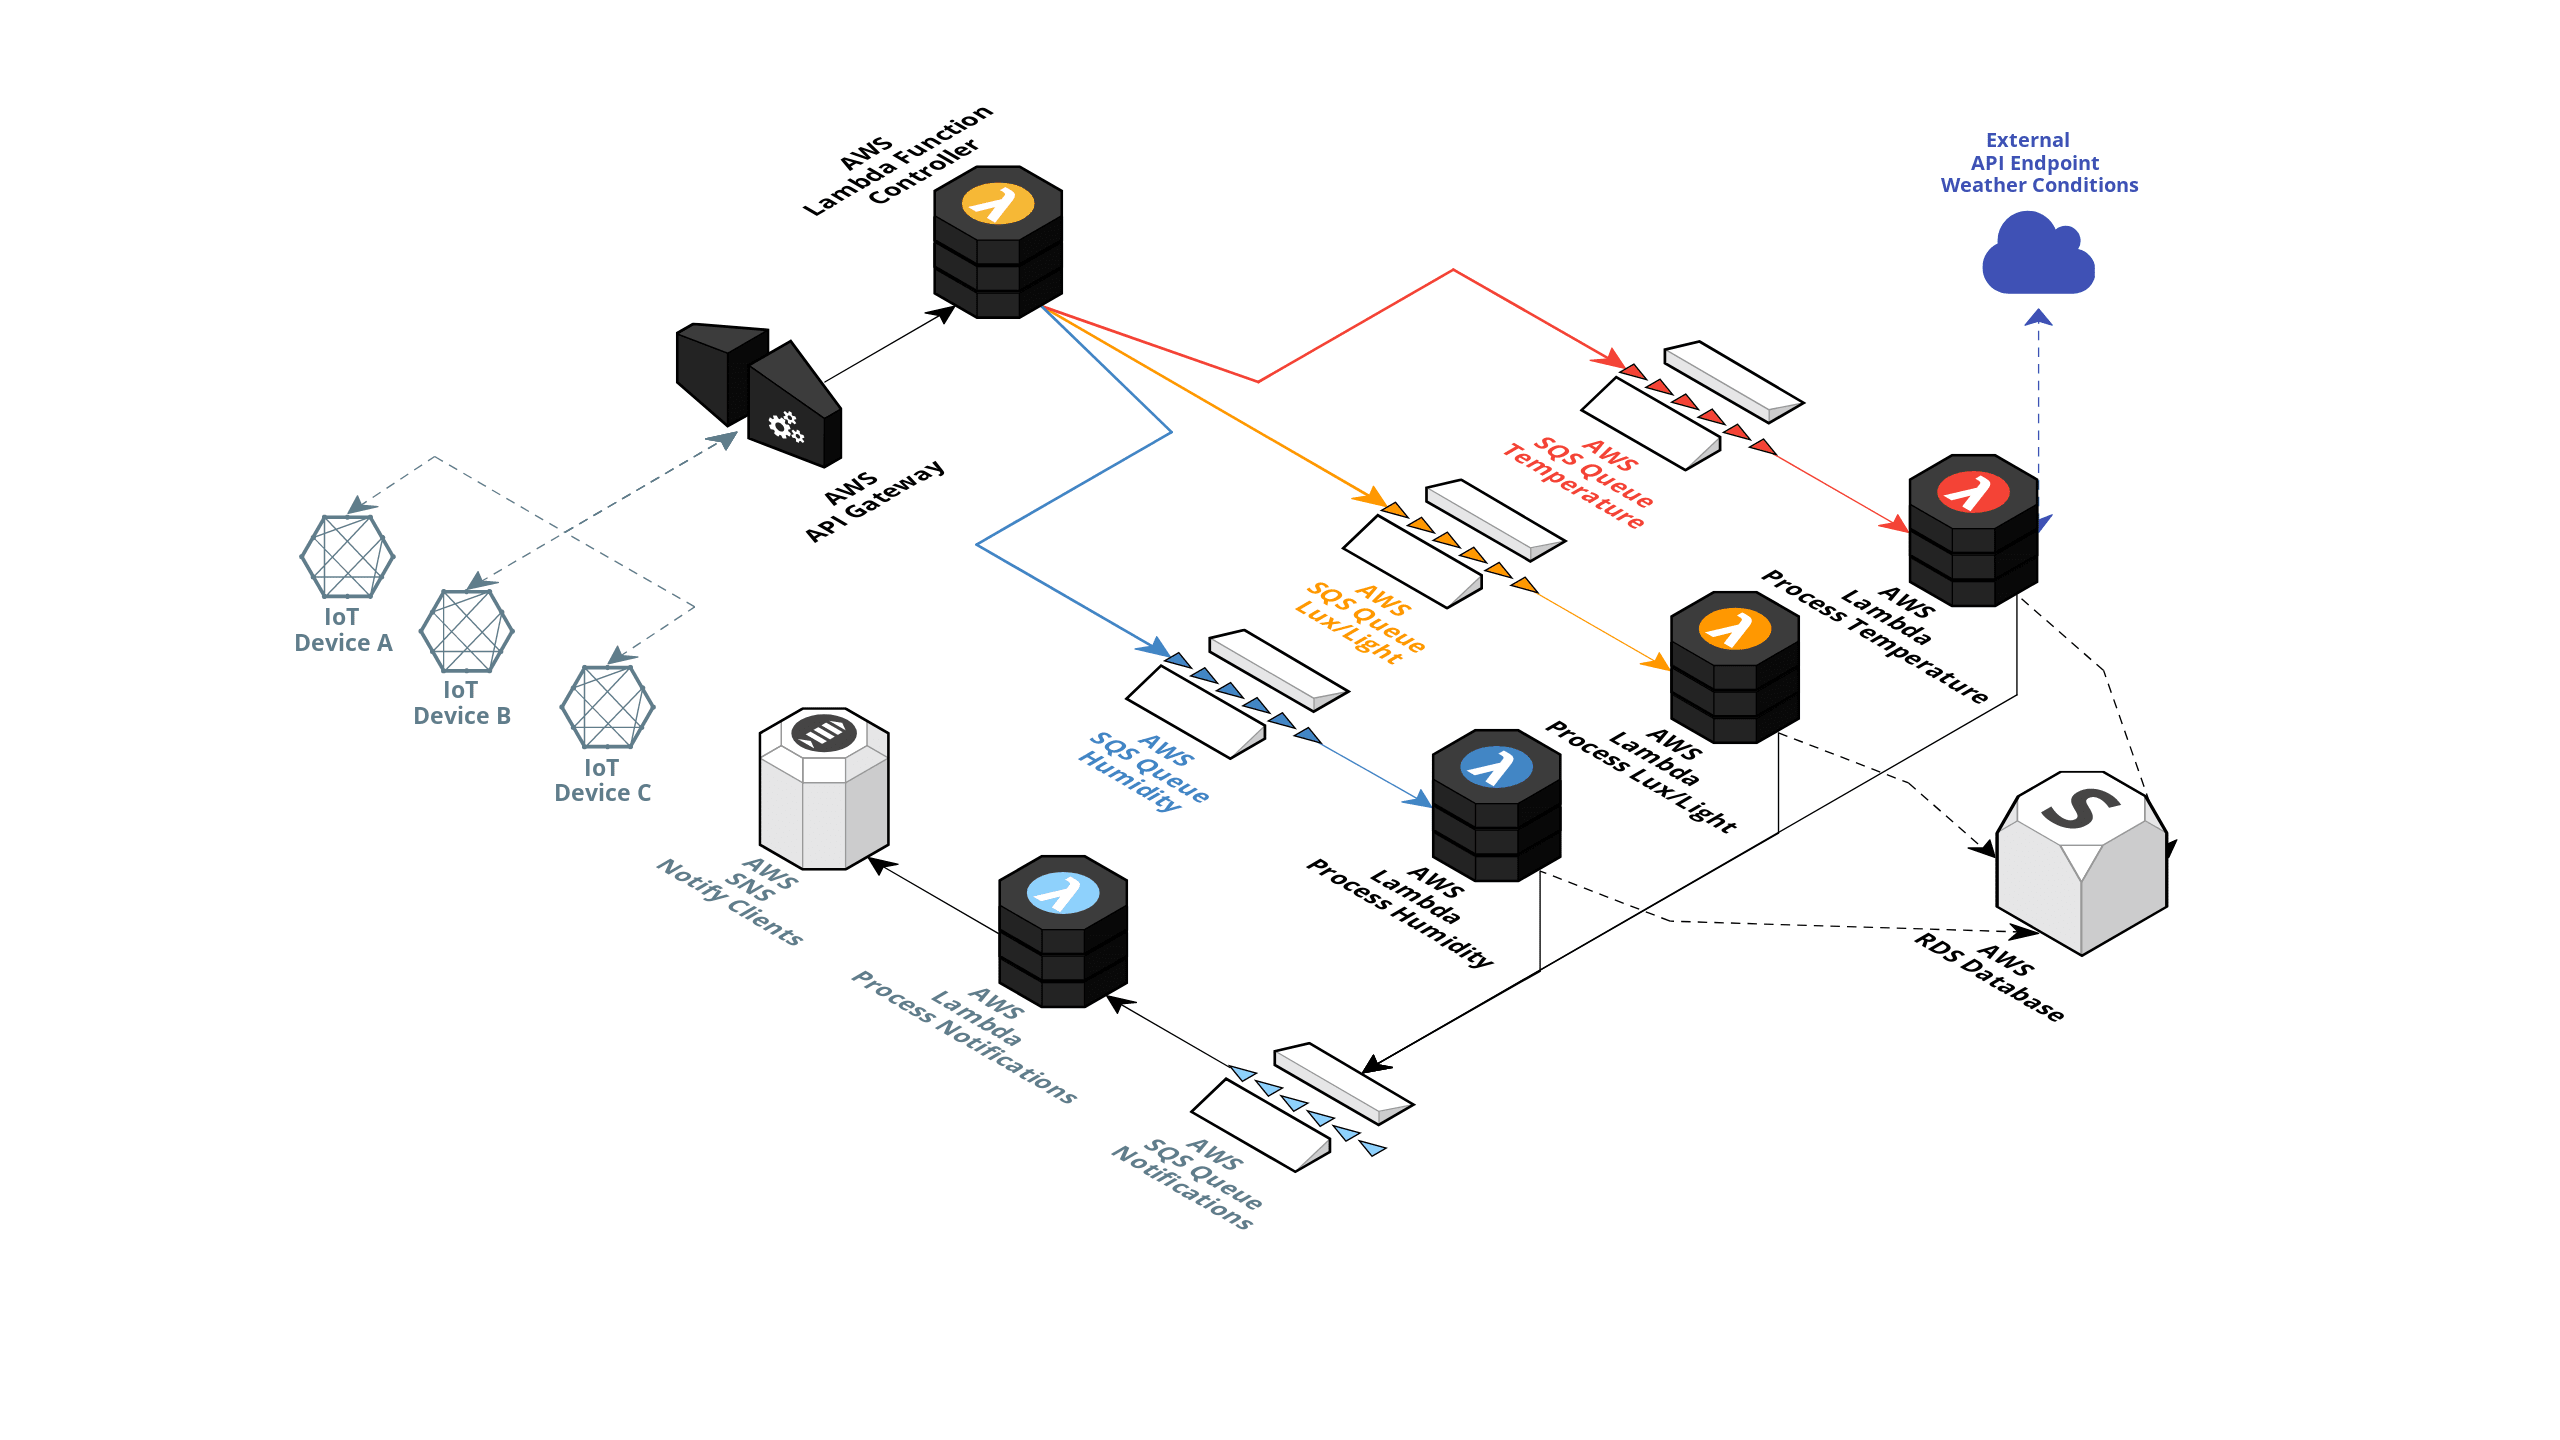
In the picture above, we have the following: multiple on-site IoT devices that are capturing various sensors data like temperature, lux and humidity.
The captured information is then sent to an AWS API Gateway endpoint with an AWS Lambda function attached to this endpoint. The captured sensor data is then forwarded to the correct AWS SQS queue with regard to the sensor type. (Indicated in the example picture below.)
The appropriate Lambda functions then pick up these SQS Messages, processes them, determines if any alerts should be triggered, and stores the values in an AWS RDS Database.
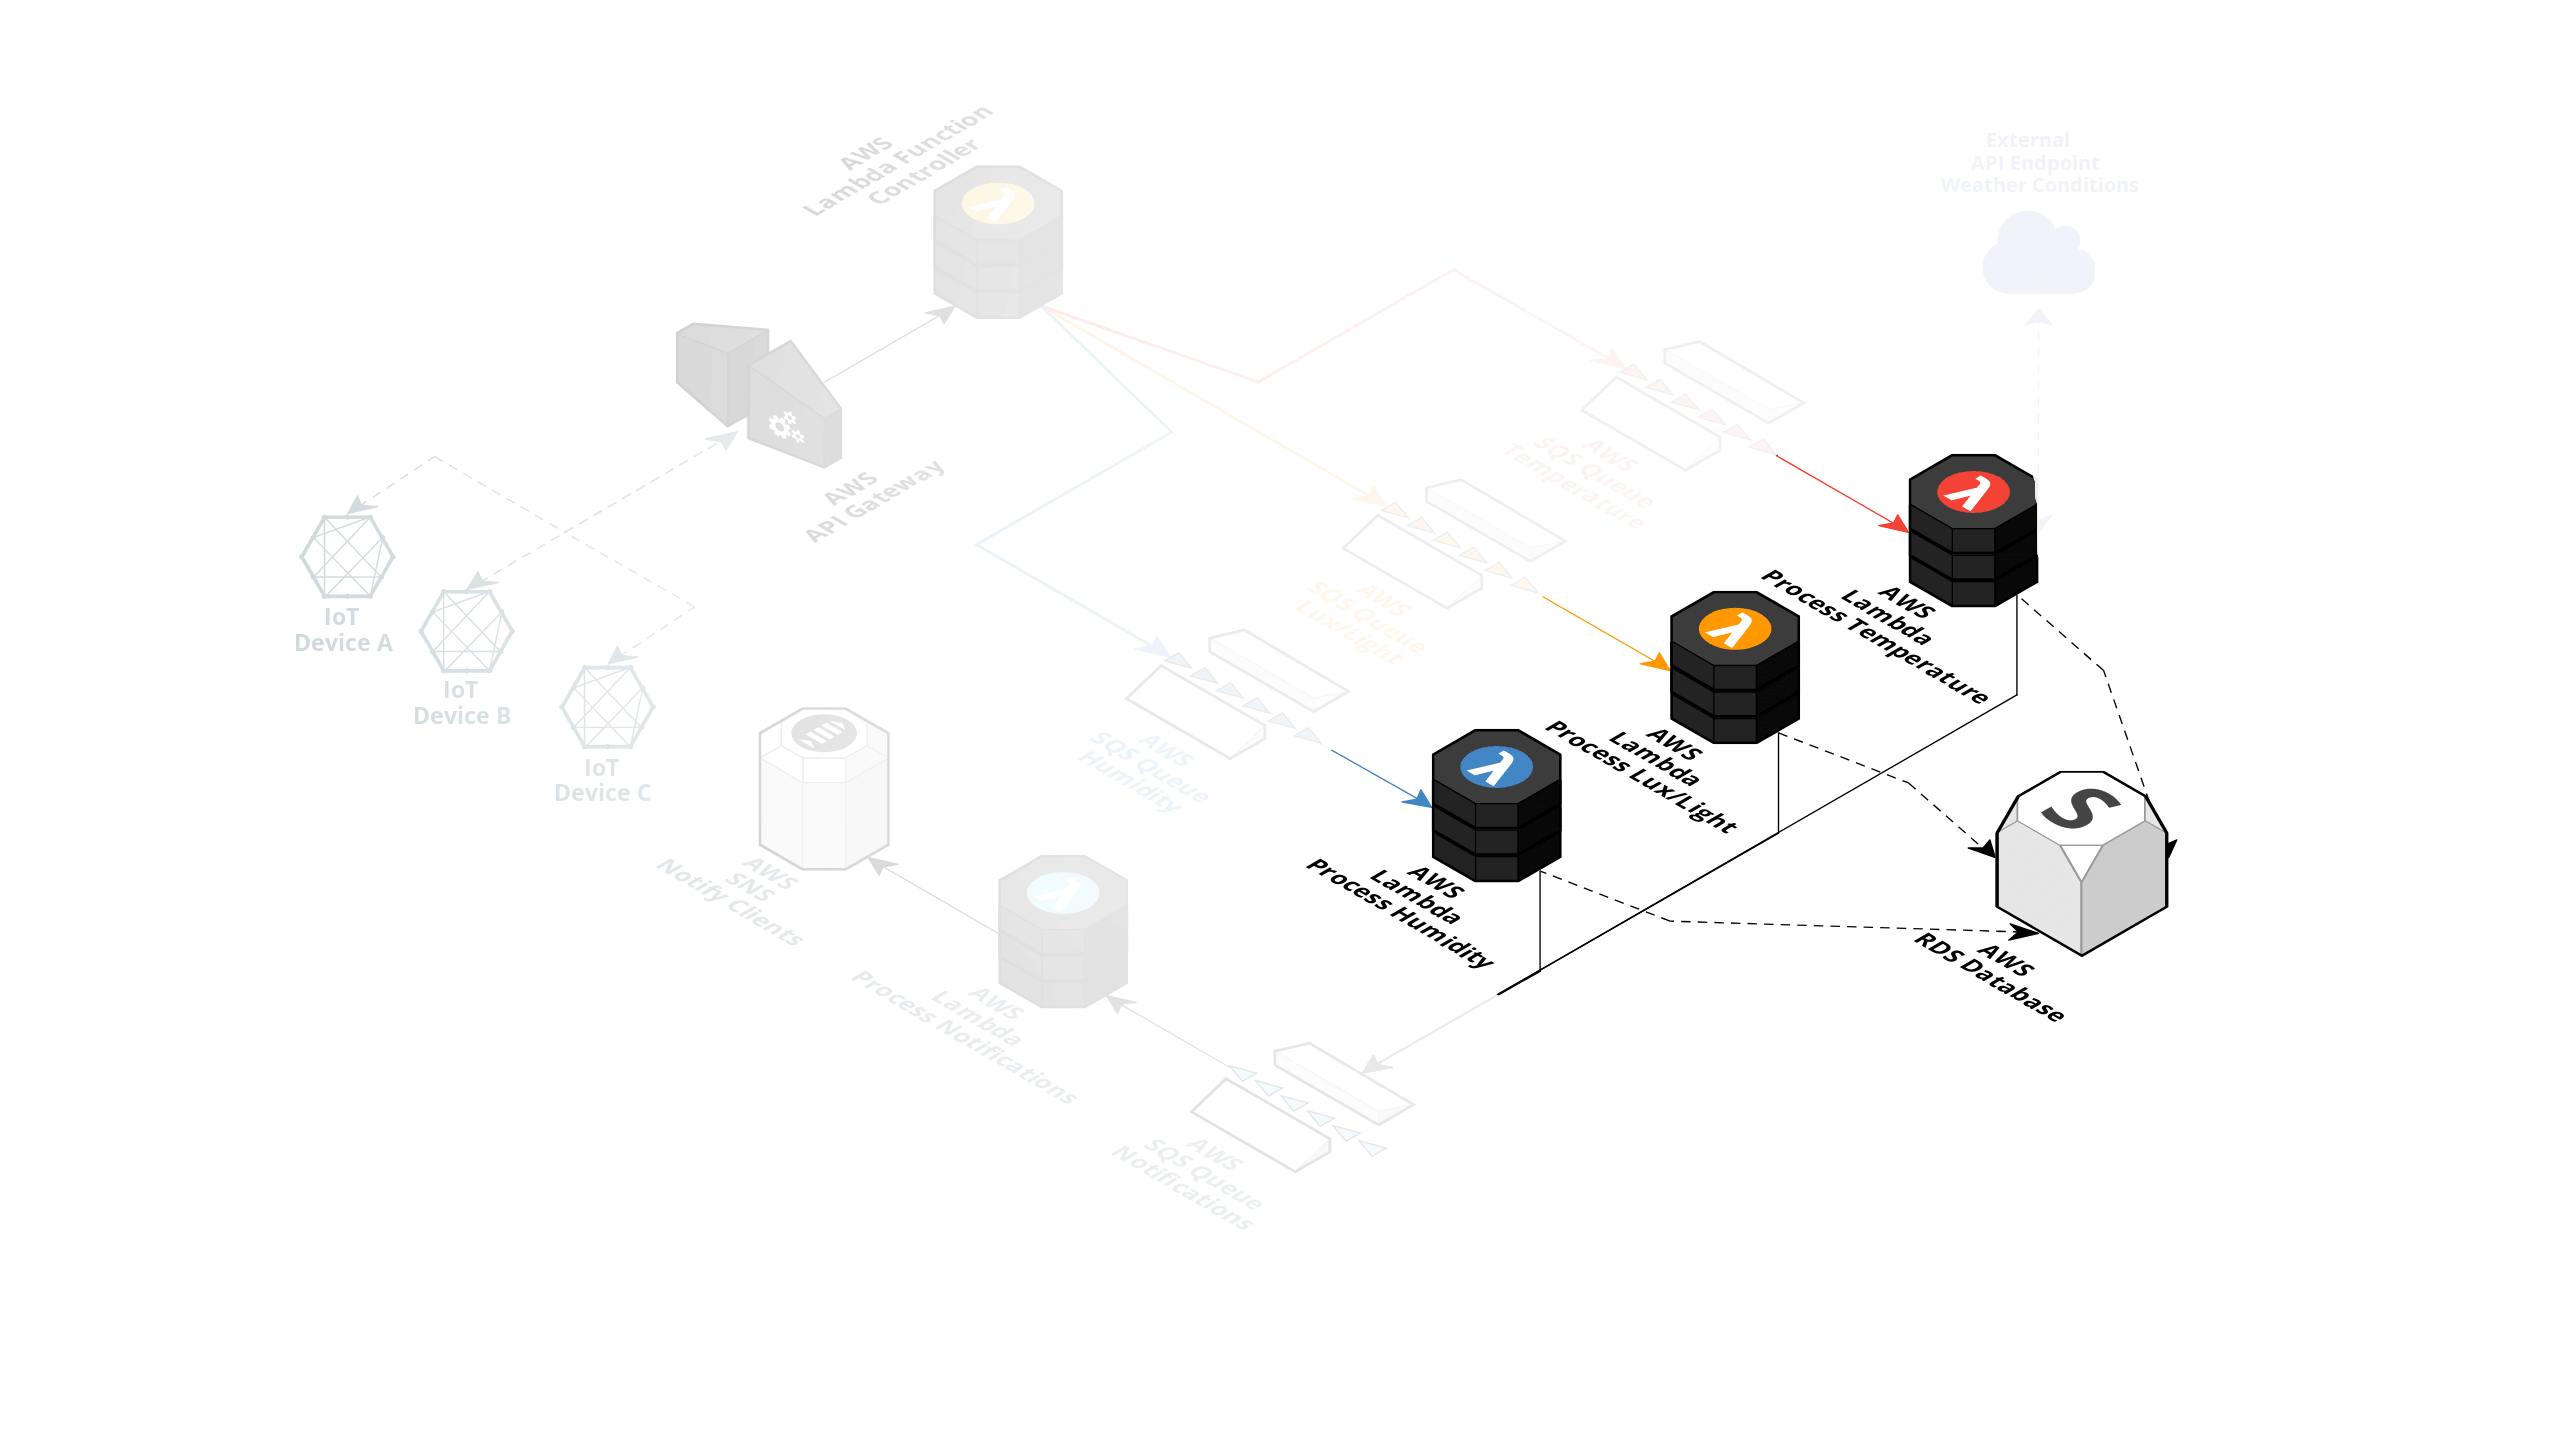
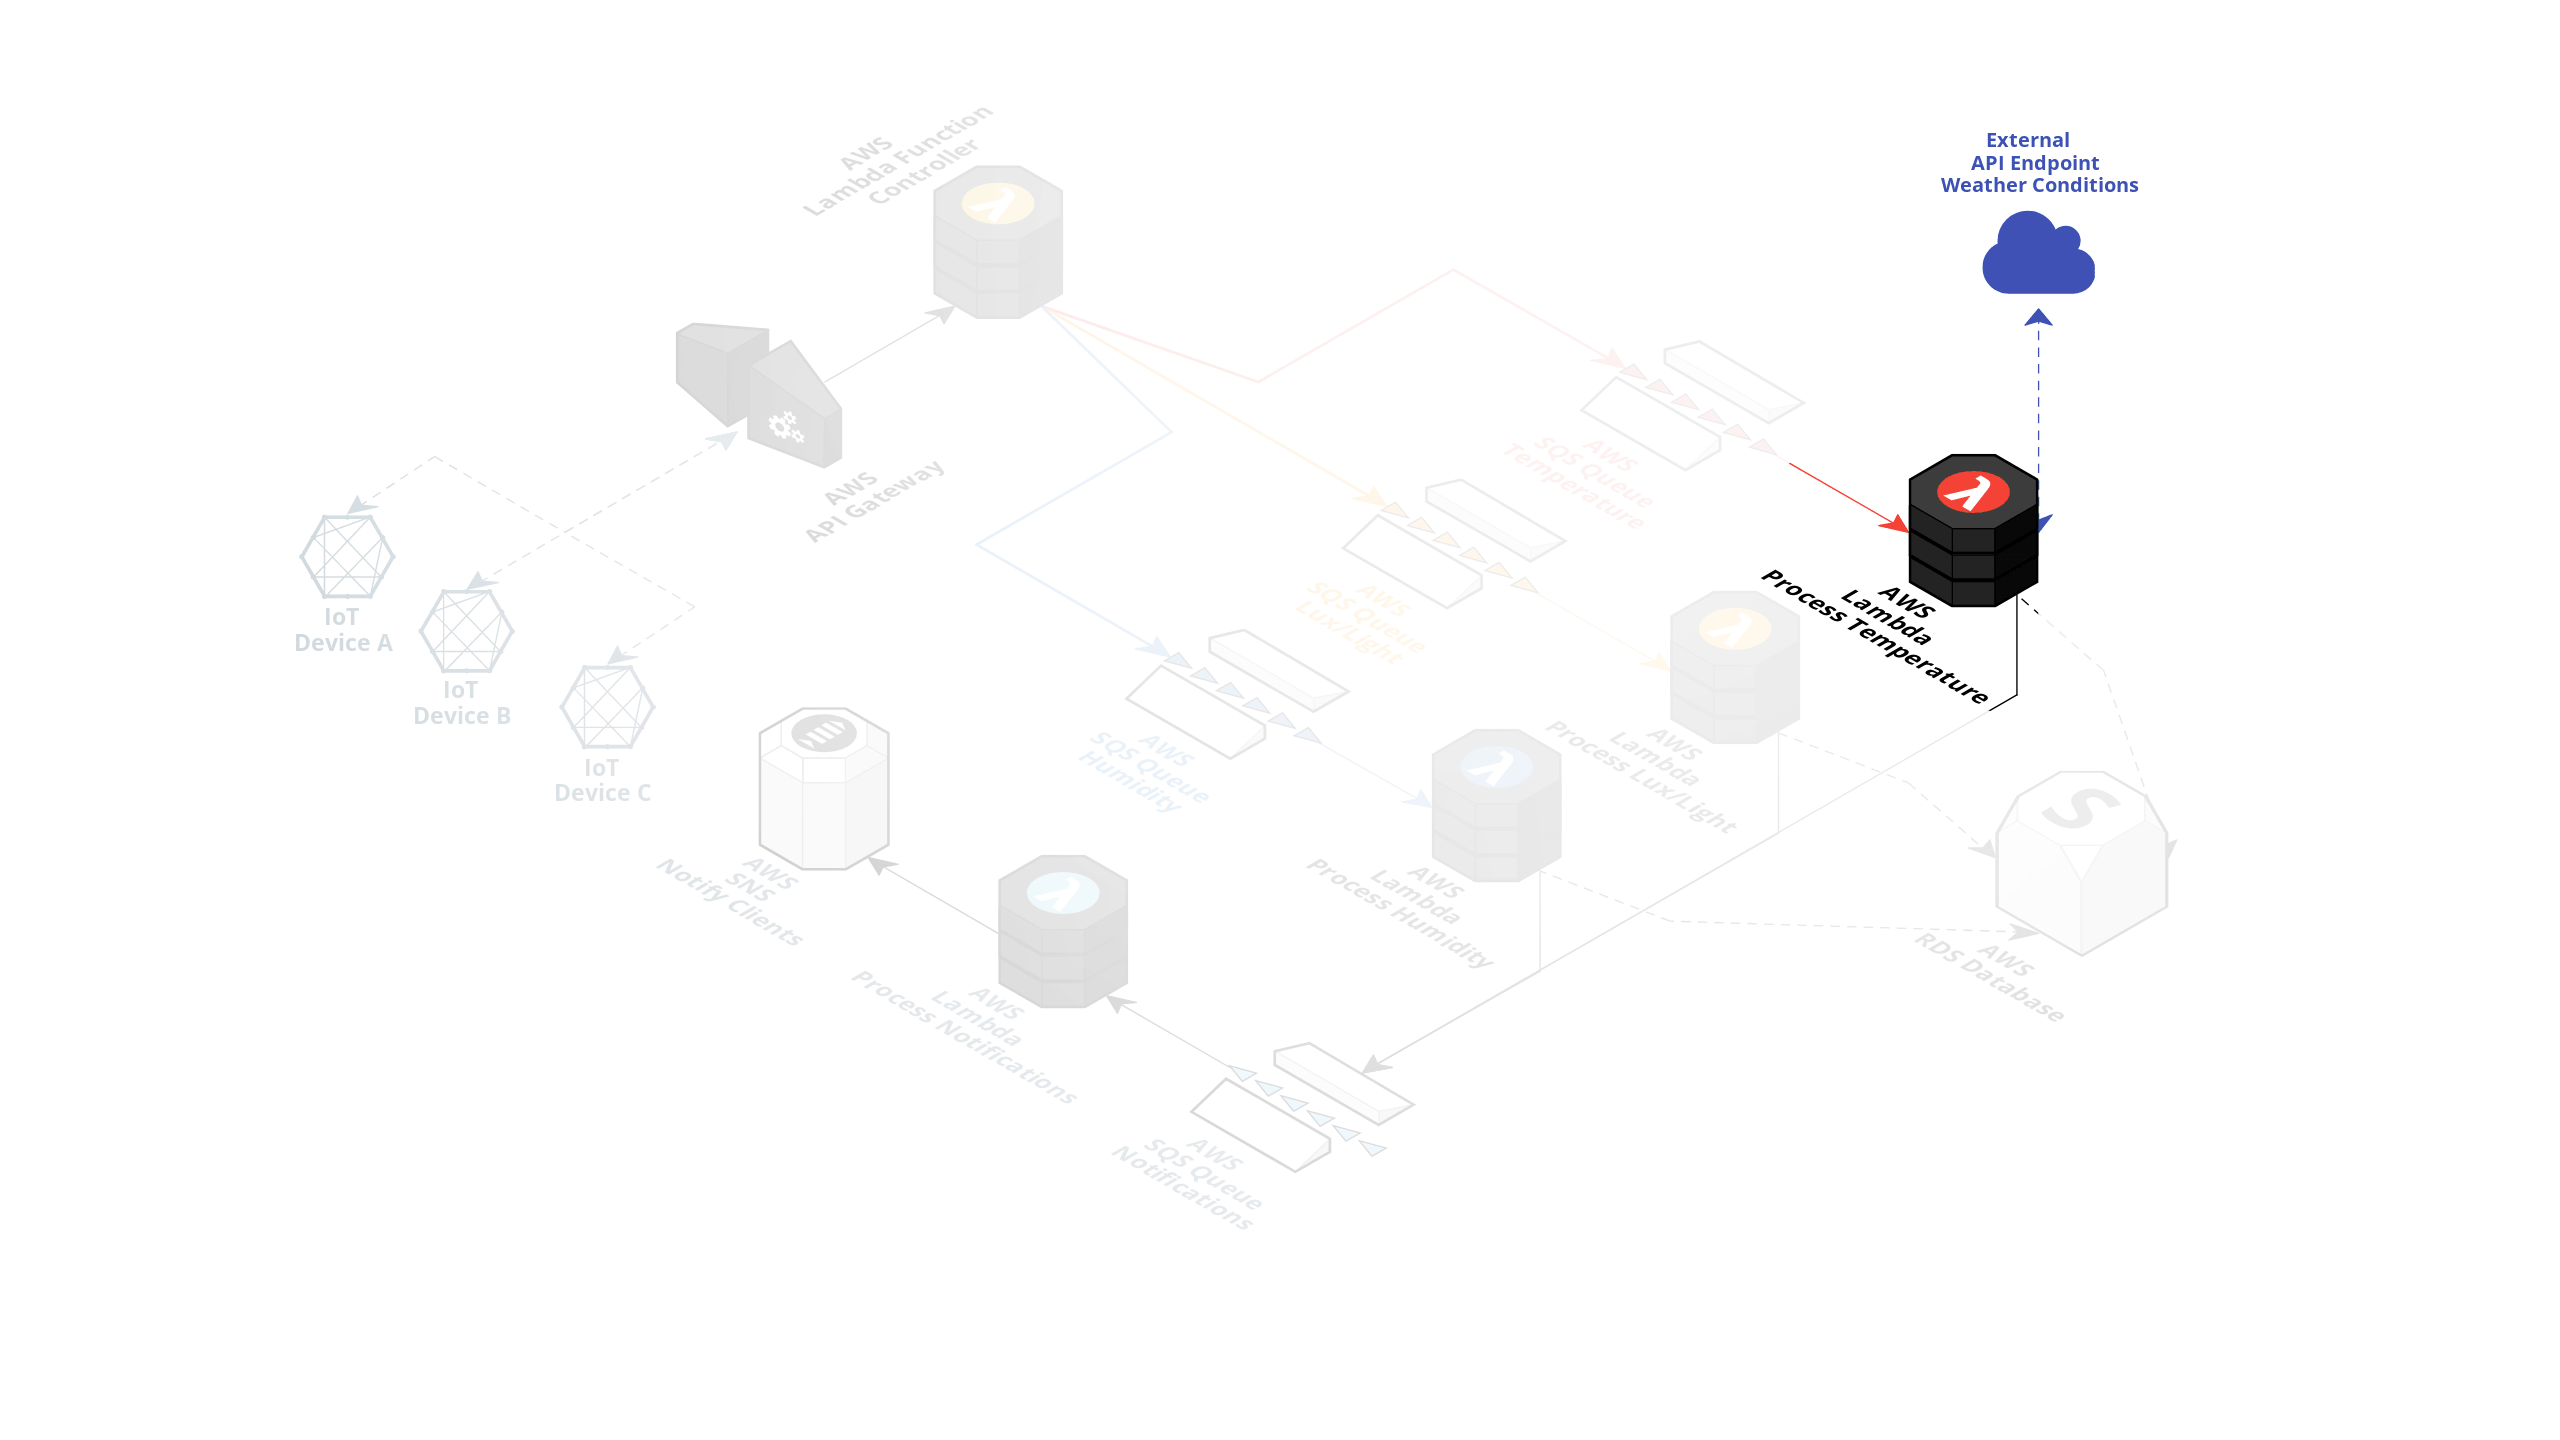
The Temperature Lambda has extra functionality where it's supposed to fetch the current weather in the device's GPS location to determine if an alert should be created based on a weather temperature formula.
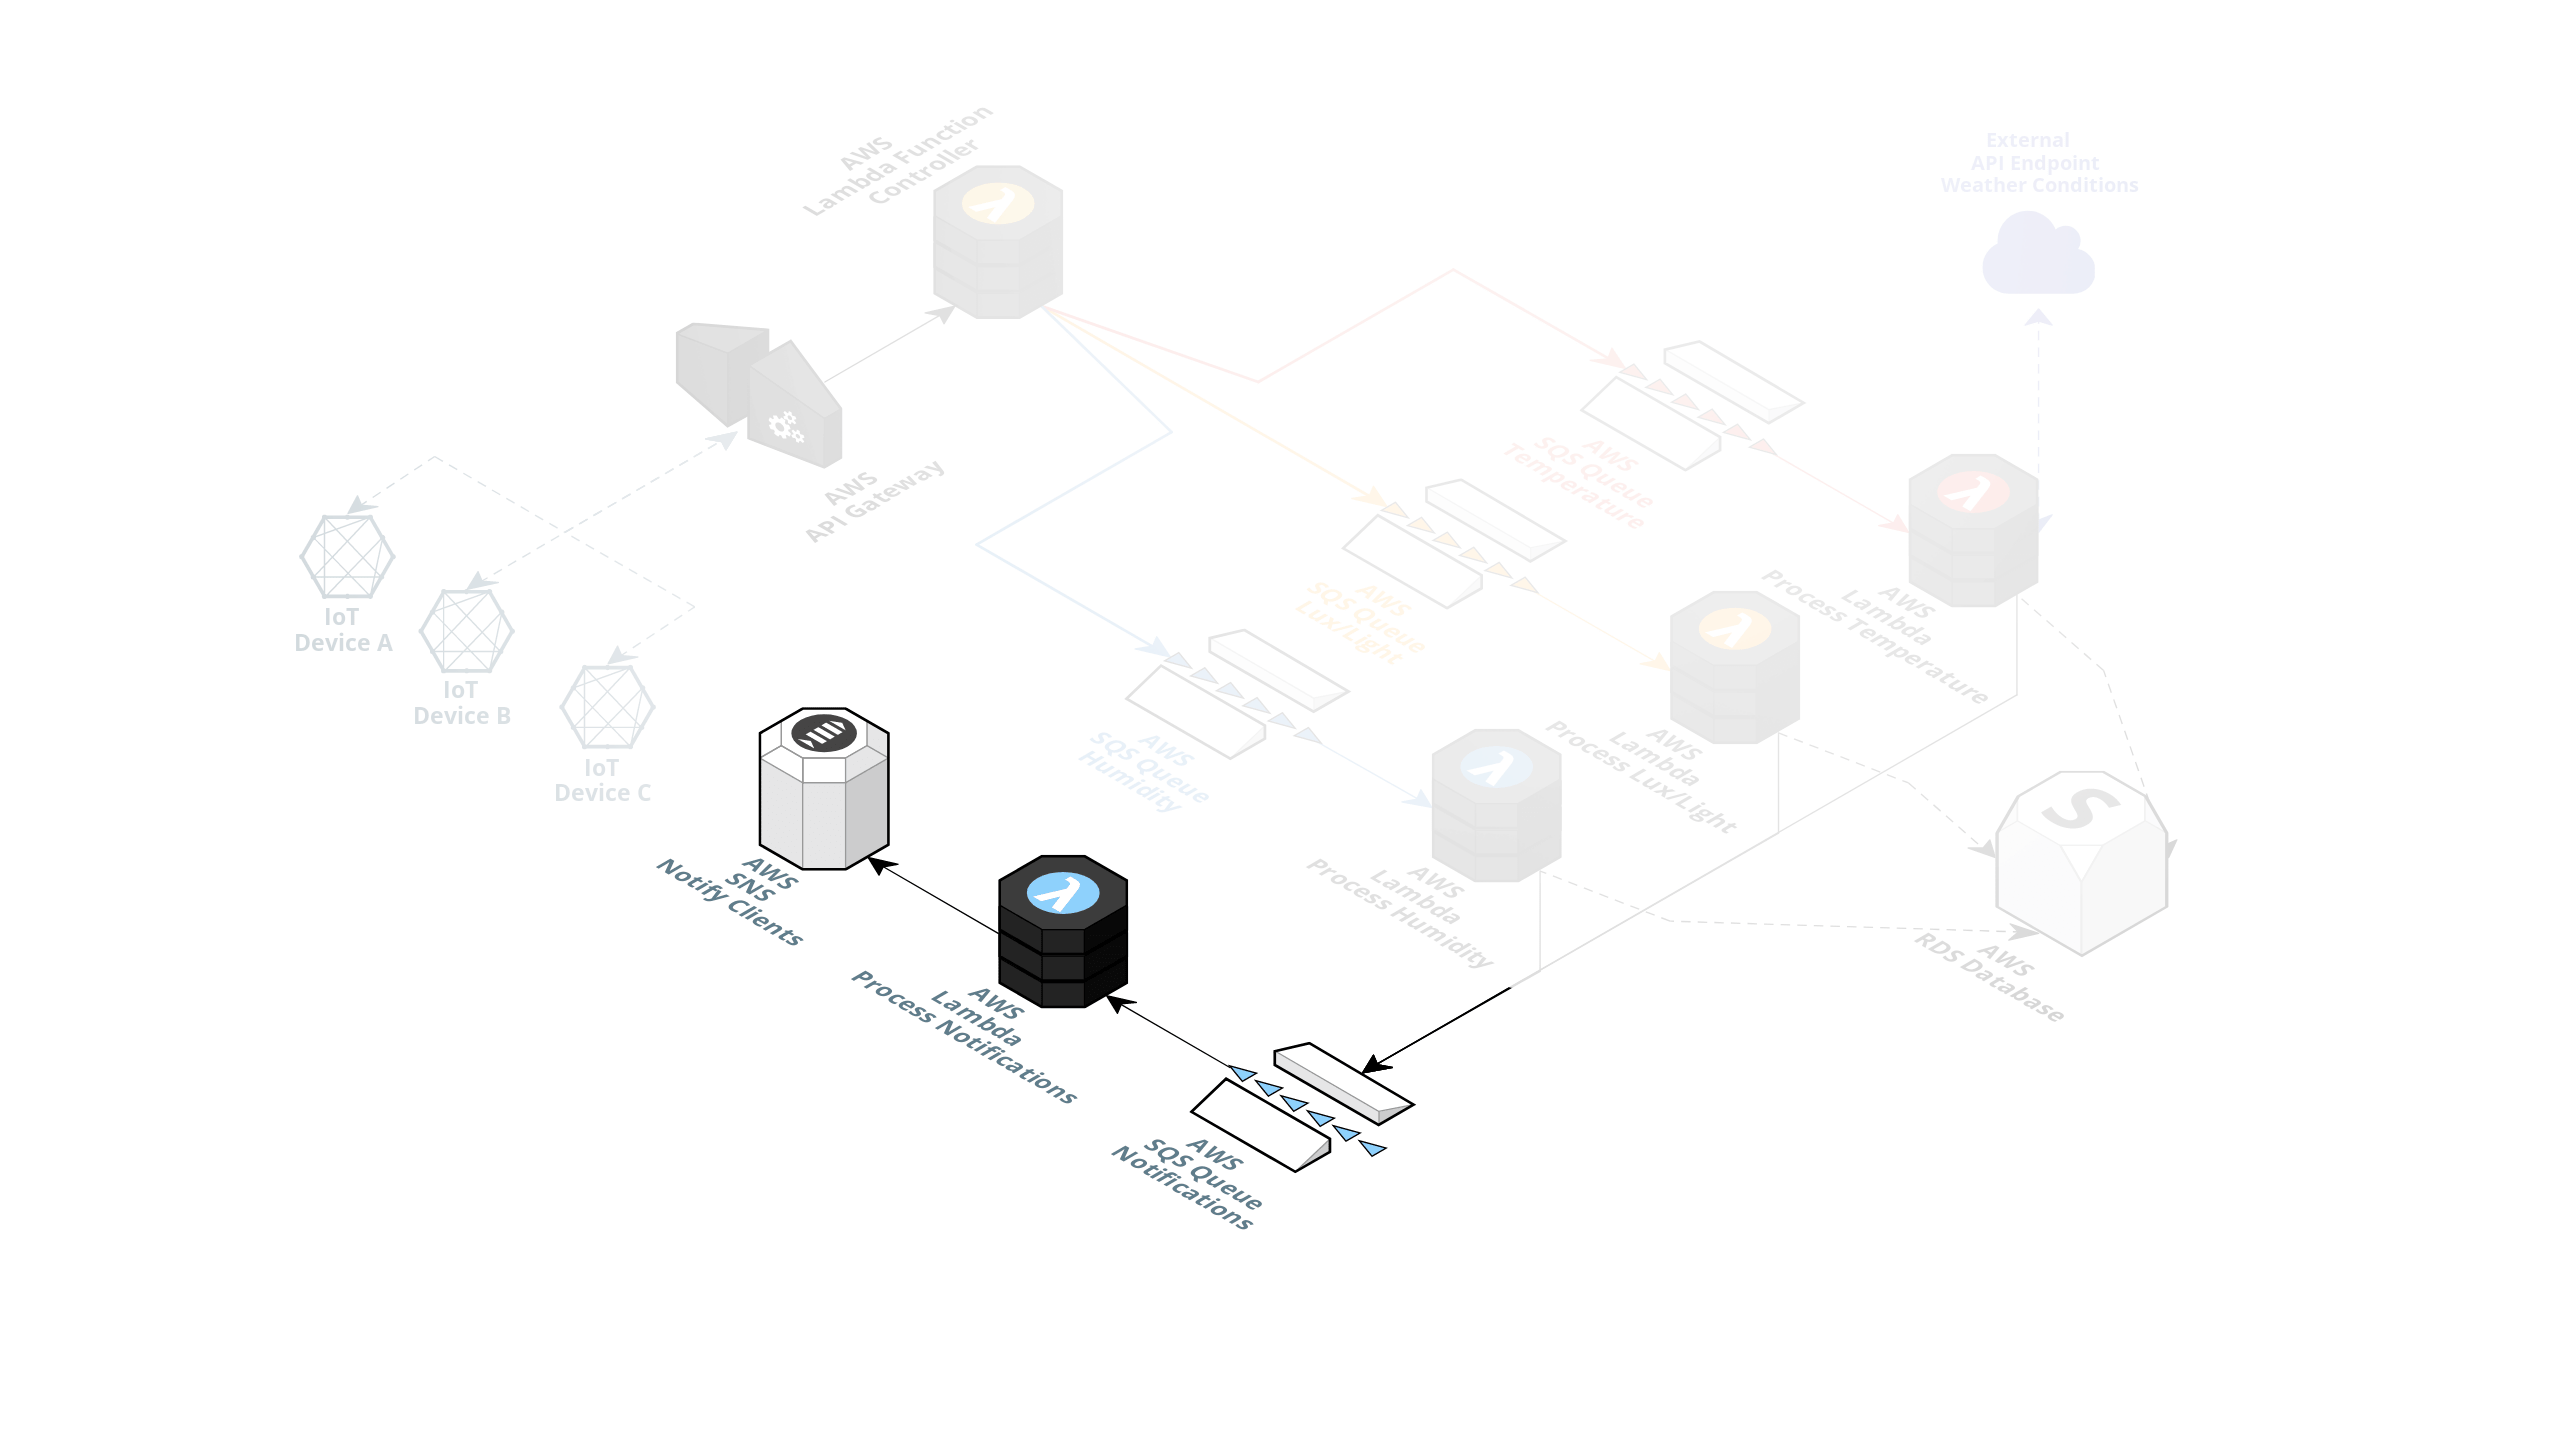
If an alert is triggered, a message is posted on another queue allowing the notification AWS Lambda to consume this message and publish an alert on an SNS topic to notify the clients.
Possible issues and errors with Serverless development
Now let's introduce a few errors within the stack mentioned above. One of the developers on this project deployed an updated Serverless stack, which caused a few things to happen. The primary Lambda, which is responsible for putting the correct sensor type data into the proper SQS queue, accidentally got a word added to the HTTP target of the Lux SQS queue; thus, the queue will not exist, causing the Lux SQS message to publish nowhere.
The expected Lux SQS Queue URL:
- <https://sqs.eu-west-1.amazonaws.com/965323806078/lux-965323806078-eu-west-1>

The Lux  SQS Queue URL posted with the new stack:
- <https://sqs.eu-west-1.amazonaws.com/965323806078/lux-965323806078-eu-west-1testname>

As you can see `testname` should not be there and was accidentally added
The second problem caused by this Serverless stack update is an expired key in the external weather API that the Temperature AWS Lambda is communicating. The developer expired the API Key while testing the Stack updates and forgot to include the new key within the stack deploy. All the API calls this function attempts to that endpoint will fail. (Let's also assume this issue slipped through the QA cycle or there is no QA cycle for this part of the system yet.)
Looking at the StackState UI, you might notice a few topology items appearing in a critical state. Do not be alarmed though, as this is intended to allow us to debug and solve the problems stated above. With it being an IoT device on-site, people might assume that the device has not pushed any Lux data and that the temperature weather formula is correct.
It might run like this for an hour or two, which may not sound that bad, but if it is a light- and temperature-critical product, you might ruin the entire batch, which will cost the company.
Solving the problem
Step 1: Build some clarity
The first step to solving the problem is to get an overview of your AWS topology, and this can be achieved by installing and setting up StackState. You can find instructions in the documentation here .
Note: If you don’t already have StackState, request a free trial.
After set-up, we still require a few steps to visualize our AWS architecture in the StackState UI. The first step is to get a StackState agent up and running. The agent will be responsible for fetching your AWS topology, telemetry, and health information and sending it to your StackState instance. You can follow this documentation to set up and run this agent.
Now that your StackState instance and StackState agent are up and running, we need to tell your StackState instance to accept data from this agent; this can be achieved by installing and enabling the StackState v2 Agent StackPack, as outlined in this documentation .
The very last step to see AWS architecture is to allow your StackState instance to receive AWS information by installing and enabling the StackState AWS StackPack, which can be done using this documentation .
Important: make sure to enable the 'IncludeOpenTelemetryTracing' option in the AWS CloudFormation template. Here’s how to do that .
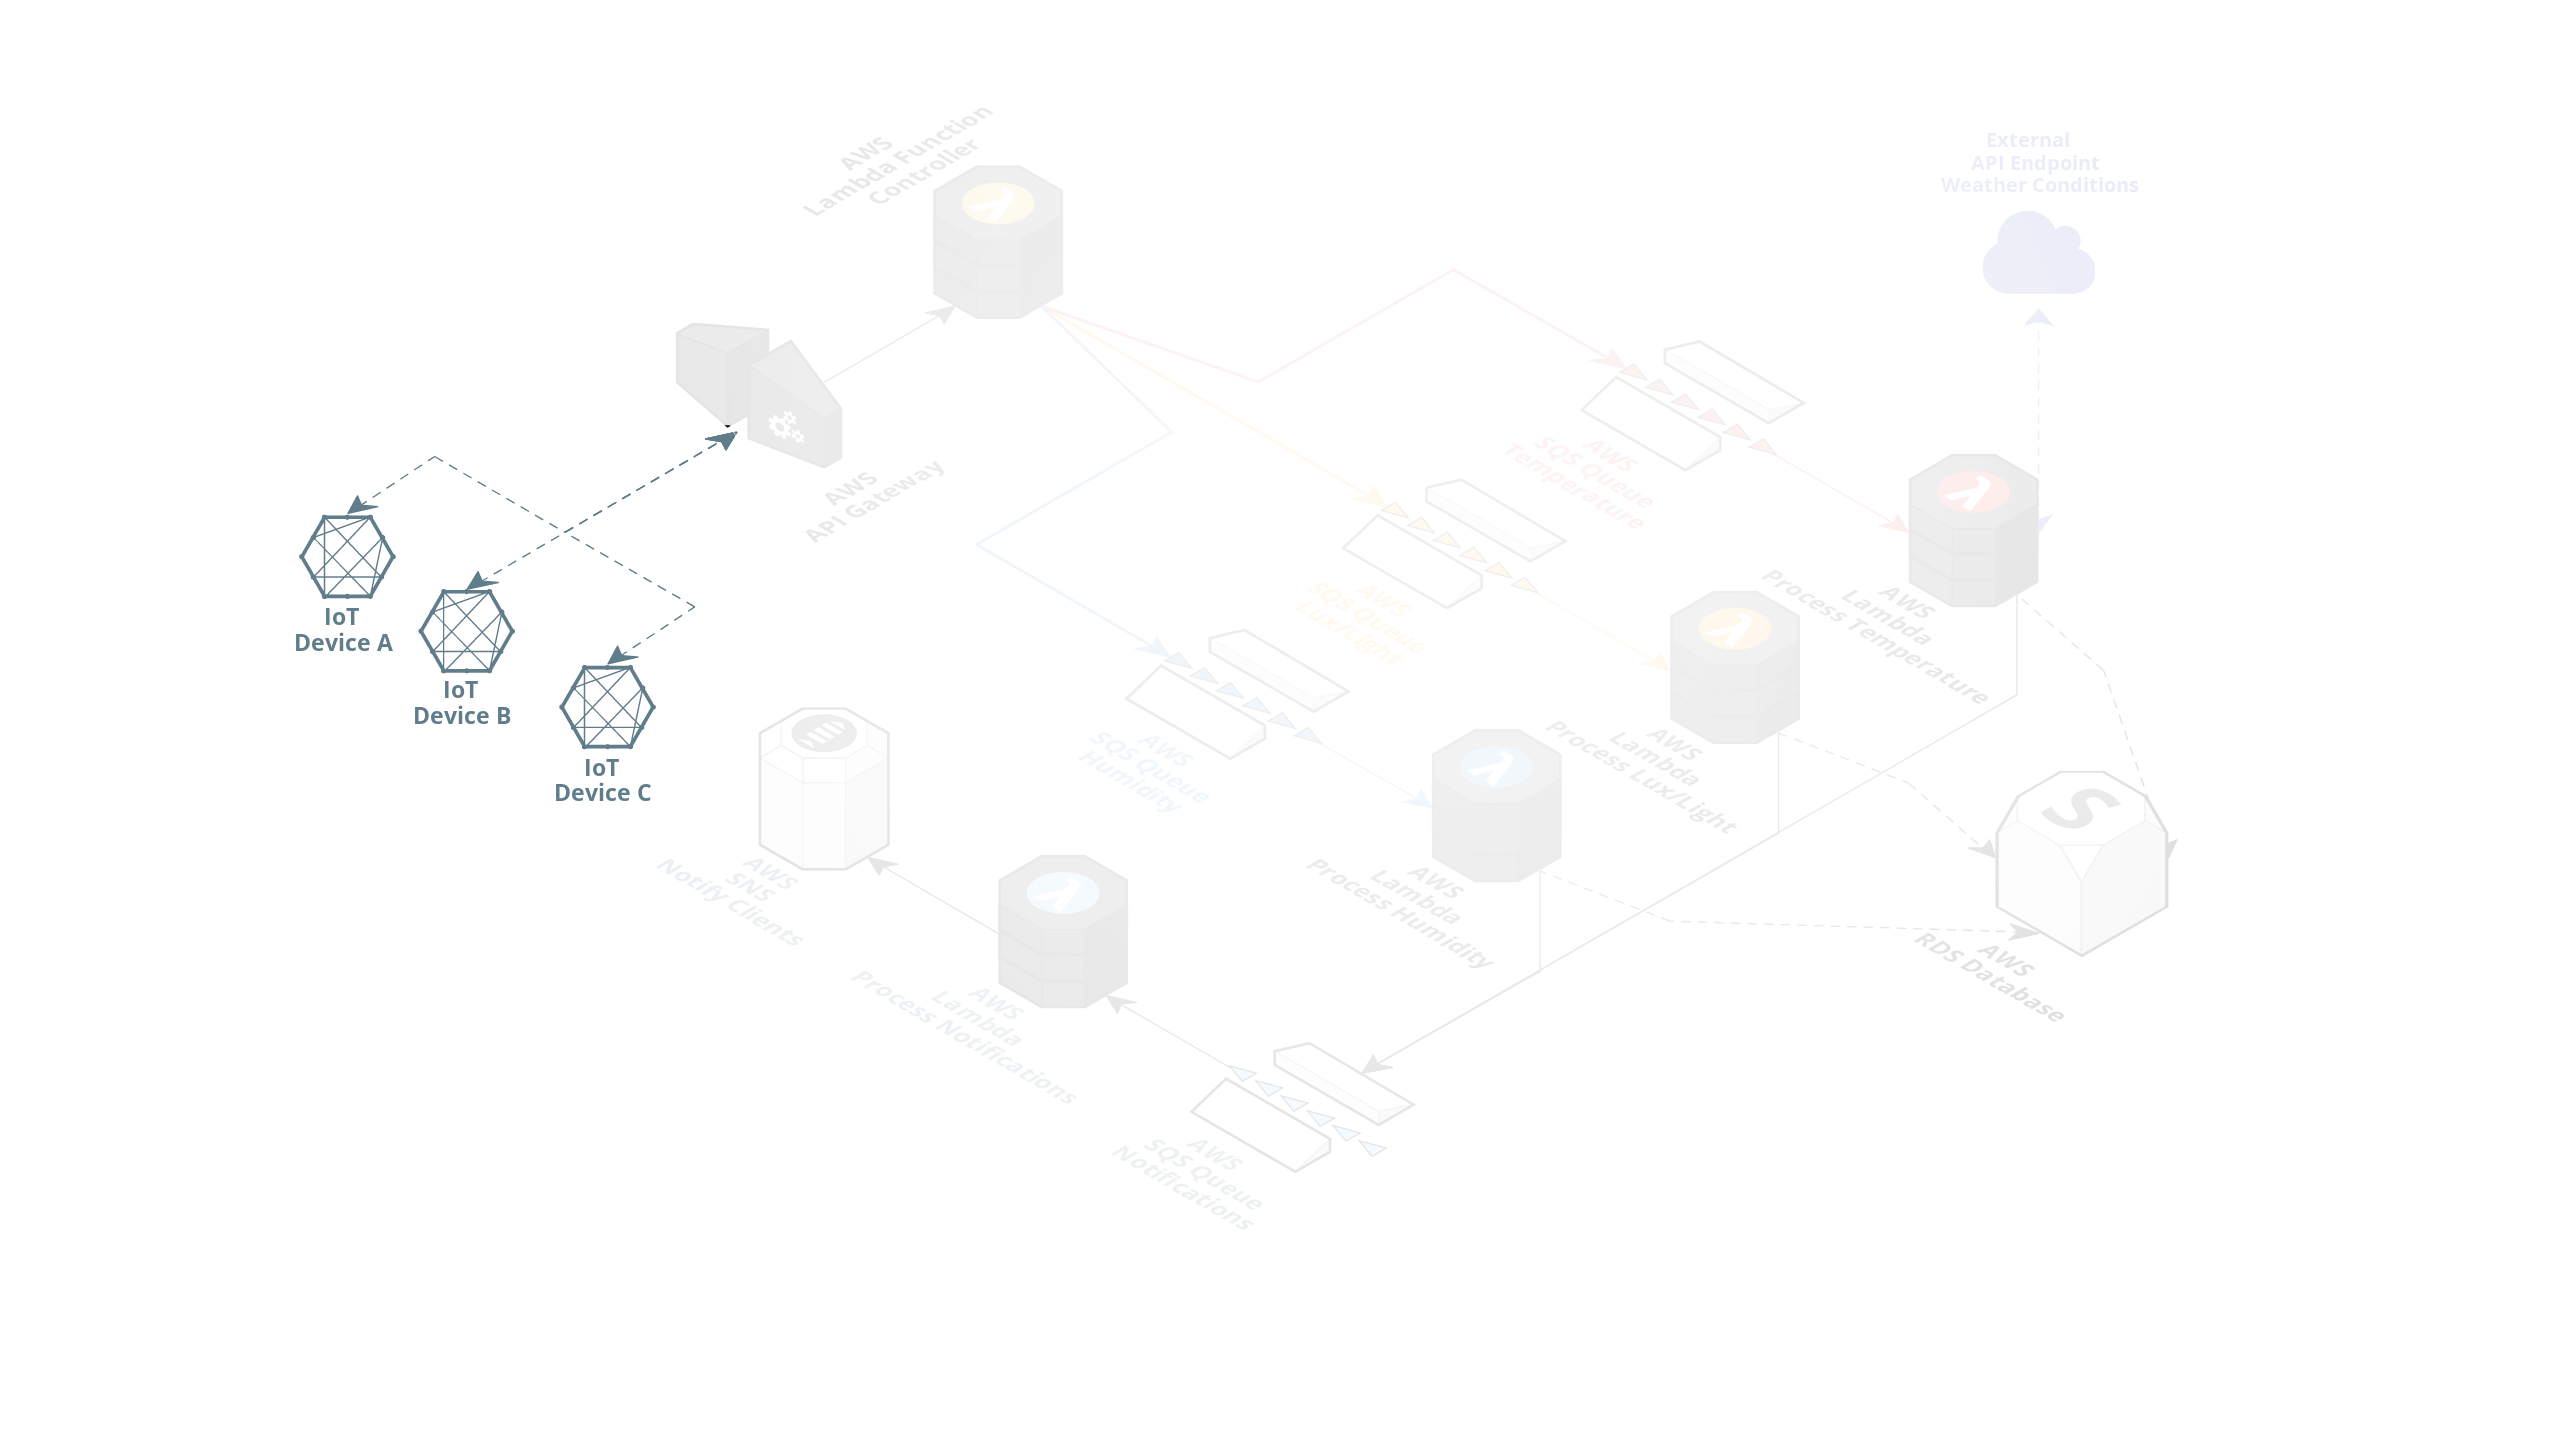
Now that we have everything set up and running as mentioned above, we will see the following topology based on the architecture we described in the first image.
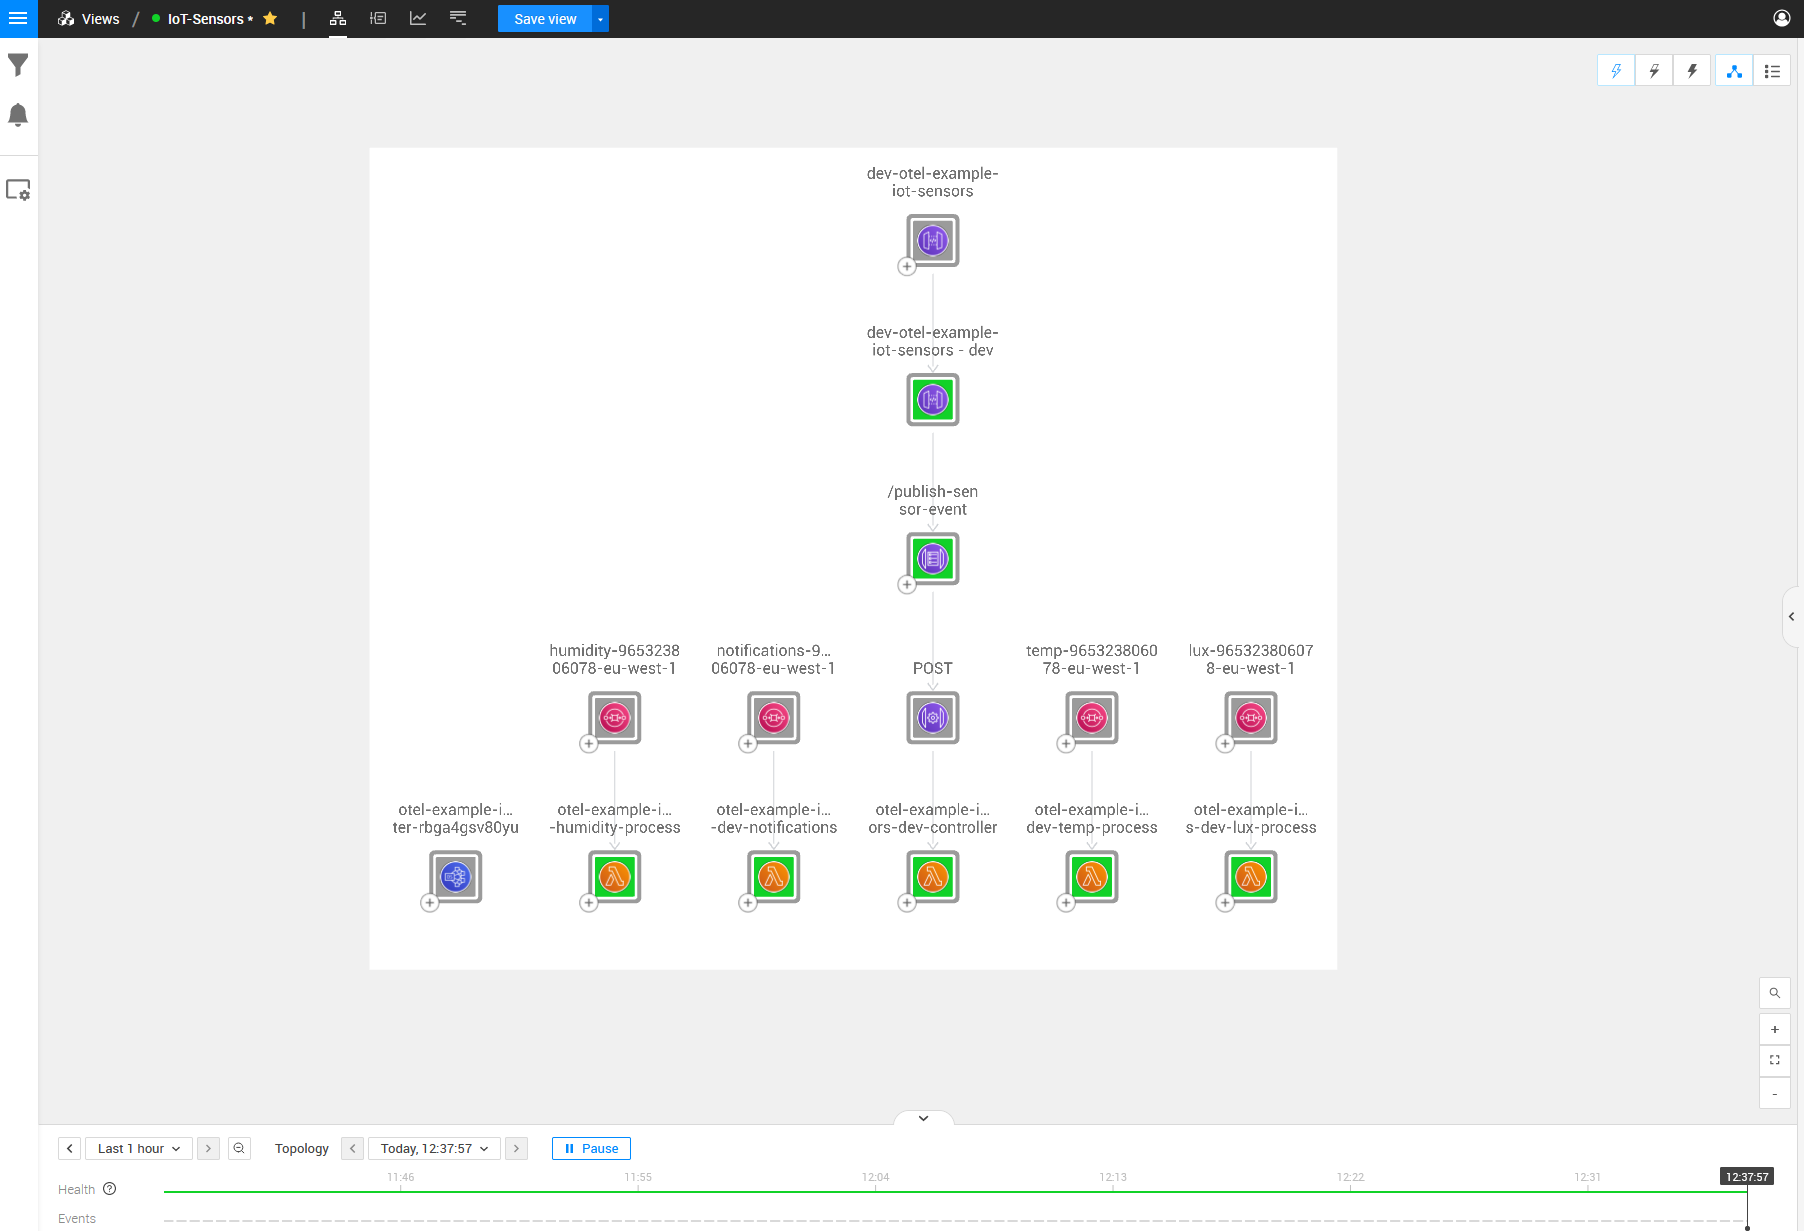
I’ll add some keywords to the image above to make it a bit more clear what parts of the architecture are running where:
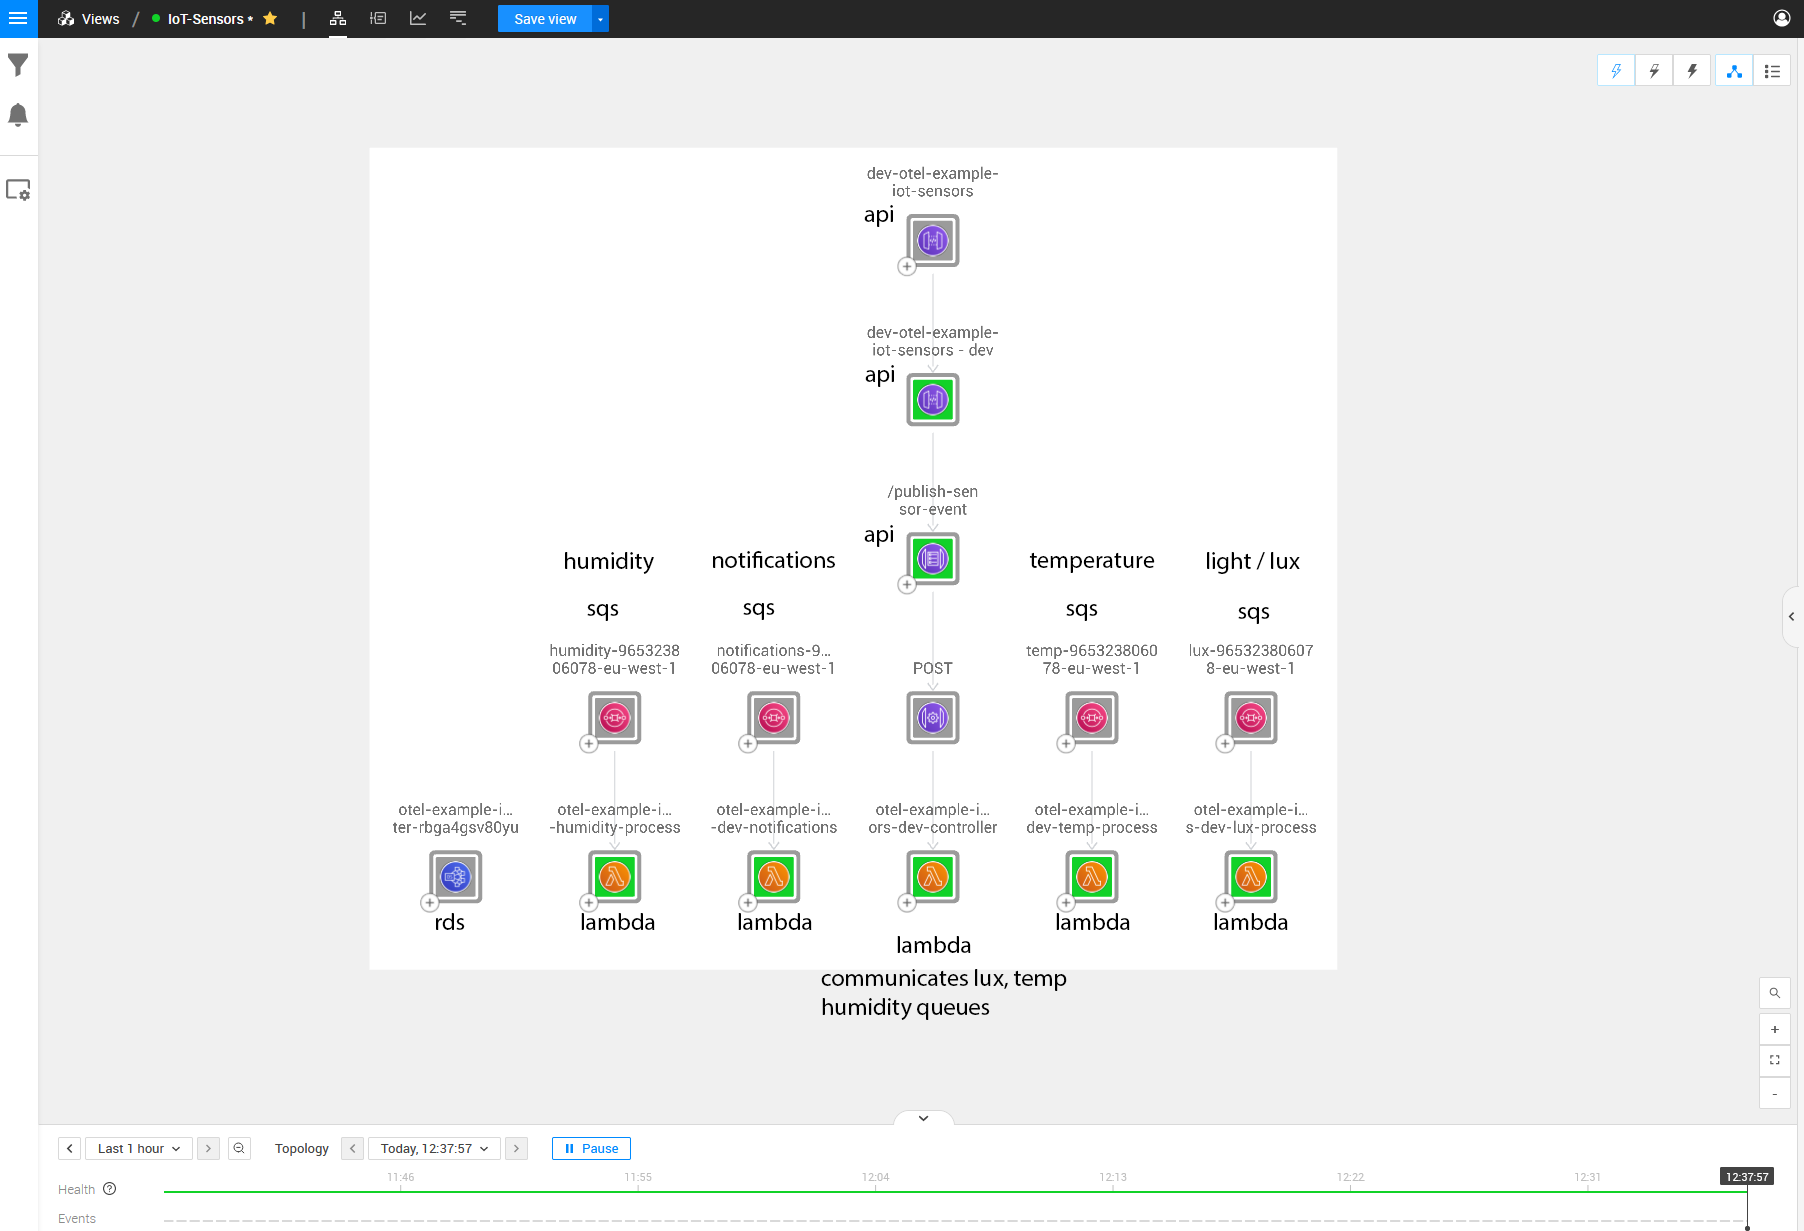
As seen in the picture, we can see the architecture for this IoT scenario but with a few missing dependencies between topology items. These relations are the crucial parts that we want to monitor so we can see where the errors originate from. The problem sits within the Lambdas’ physical code, making it challenging to discover through just topology and telemetry; thus, this is where the StackState OpenTelemetry solution for traces comes into play.
For example, we cannot see the API that the controller Lambda is communicating with. We can also not see the communications between the Lambda that receives the API Gateway Posts and any other queues on which it is adding messages.
Step 2: Investigate and troubleshoot
So let’s get started using OpenTelemetry. As said, make sure to enable the 'IncludeOpenTelemetryTracing' option within the AWS CloudFormation template. If that option is enabled, you can follow this documentation to use the OpenTelemetry Lambda Layer within your Lambda functions.
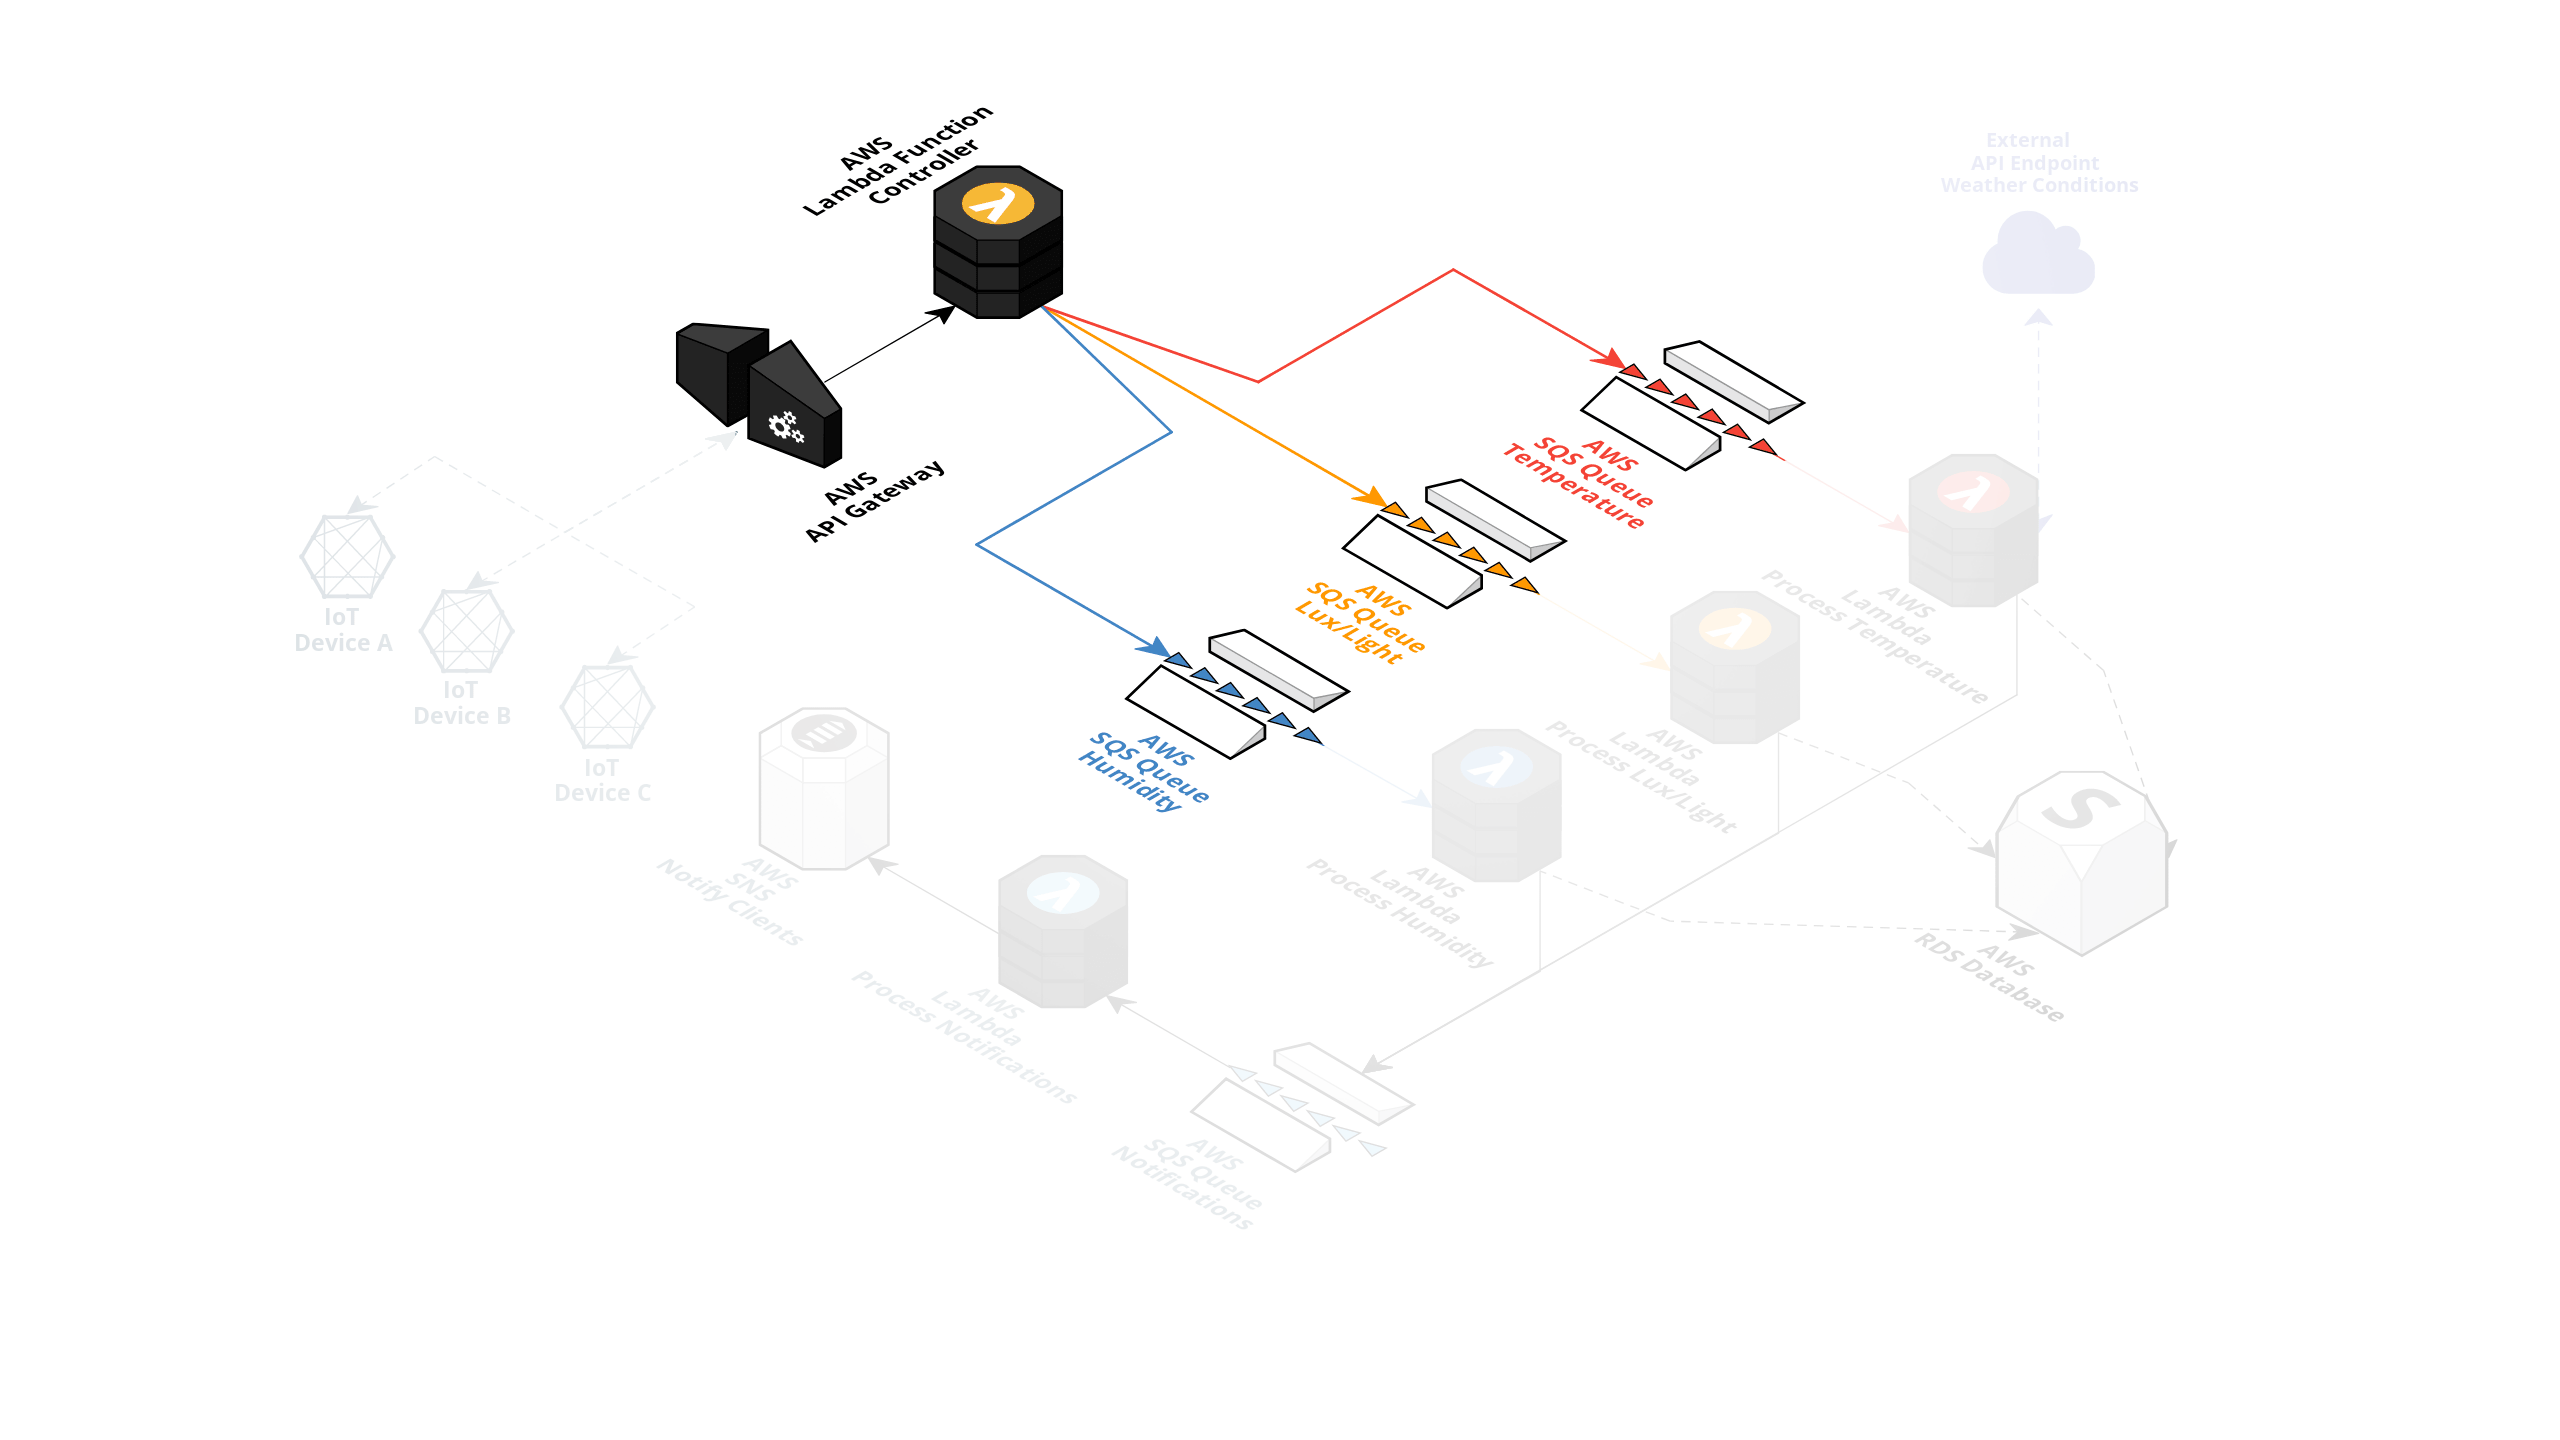
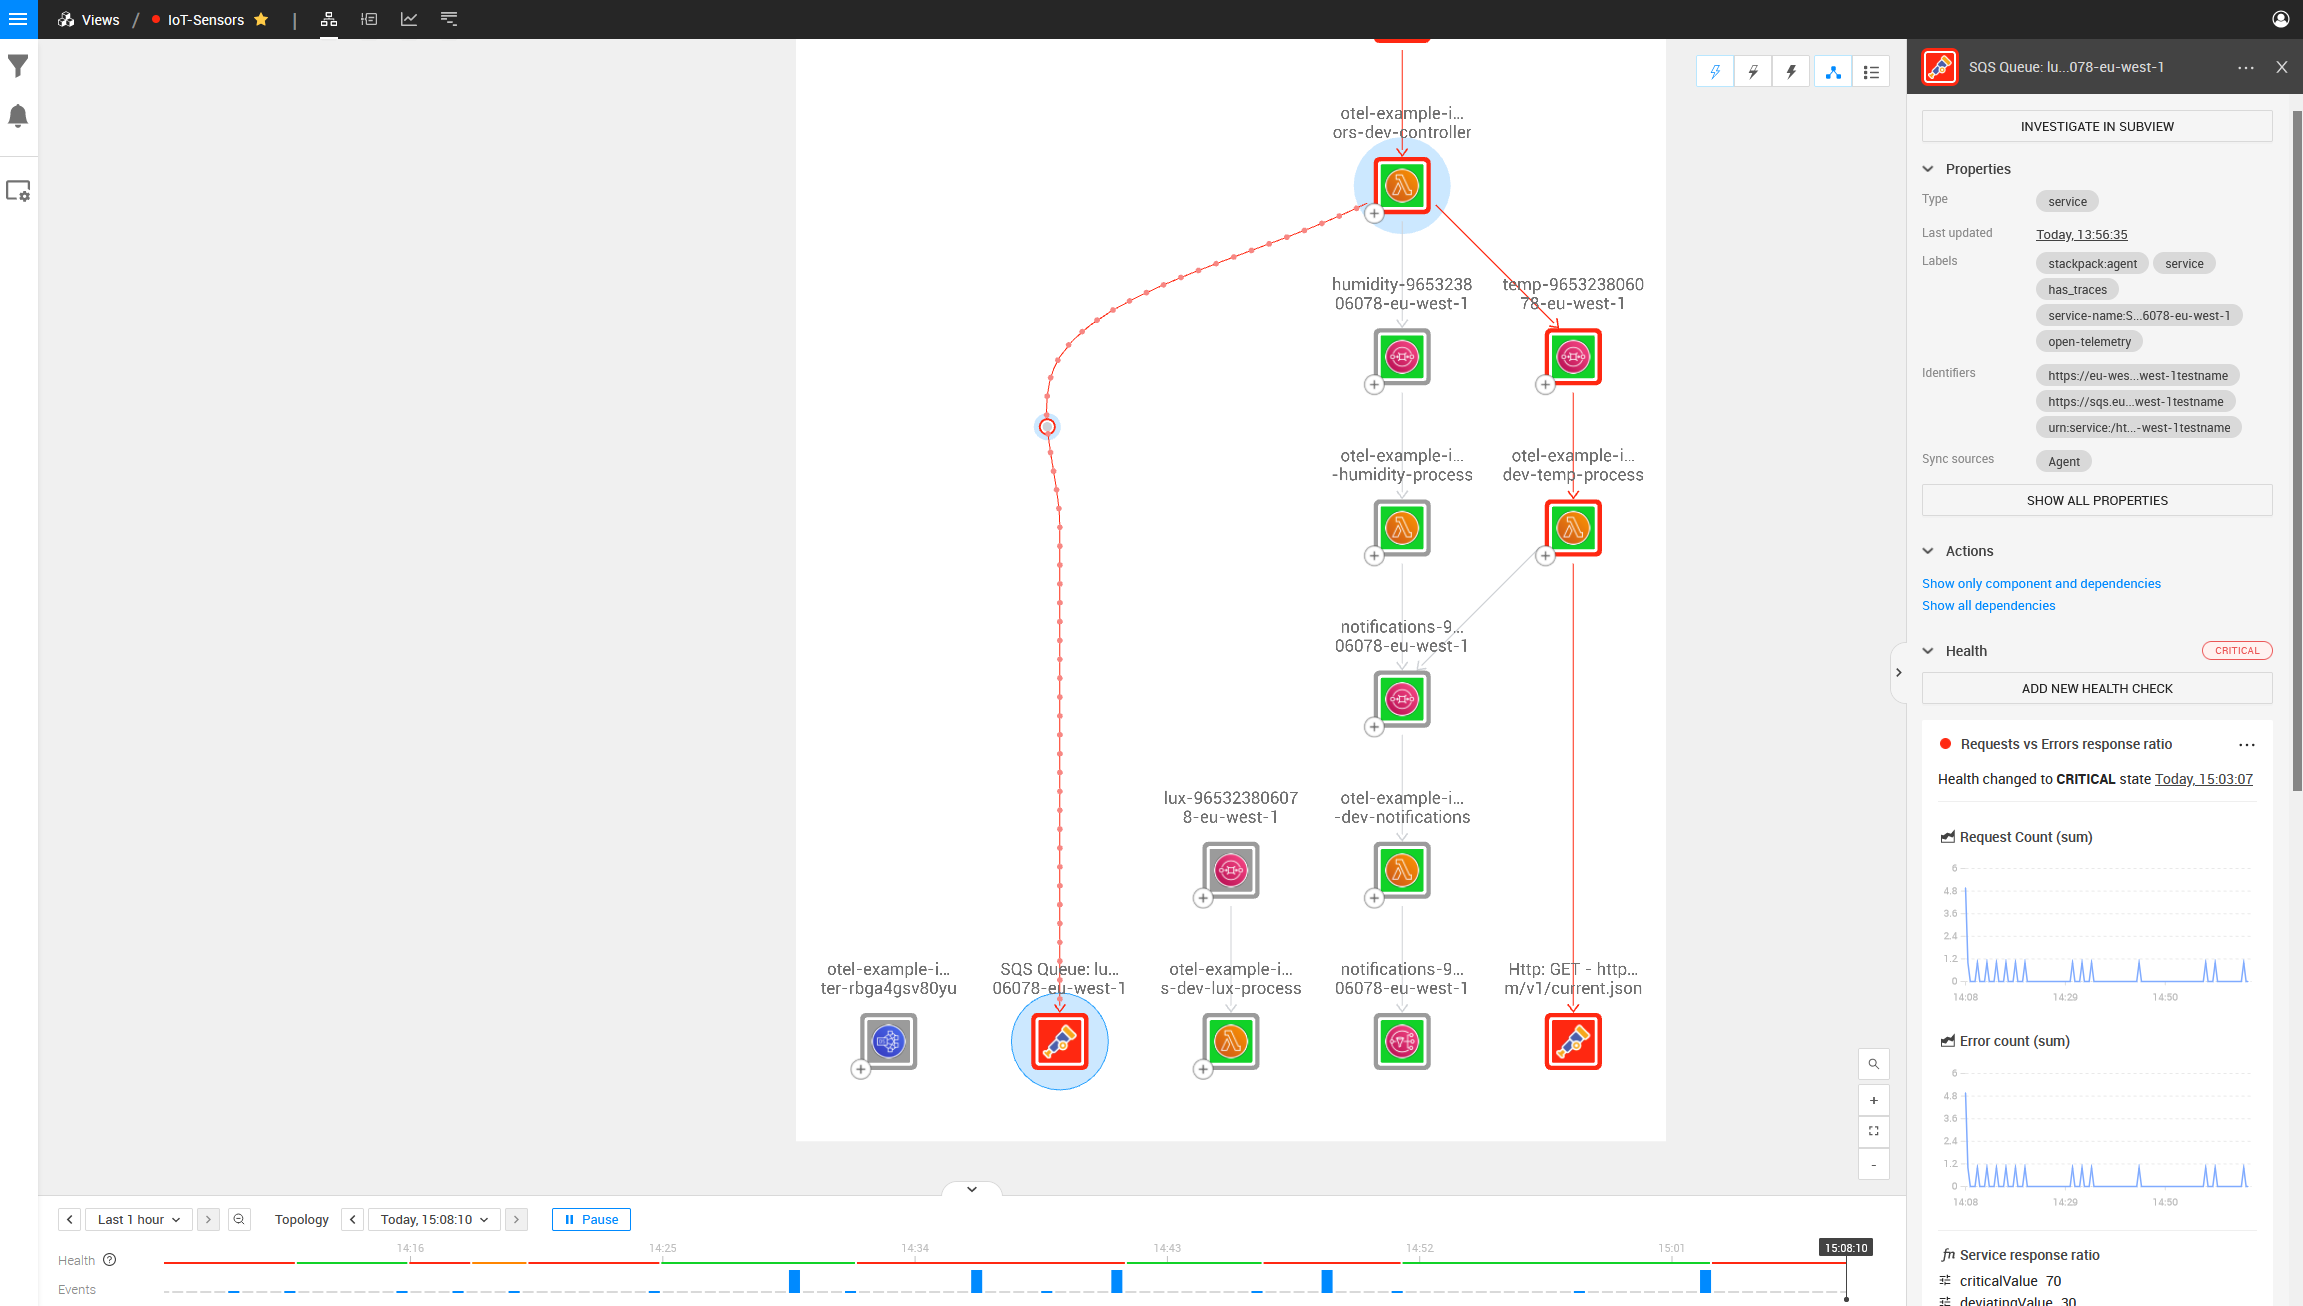
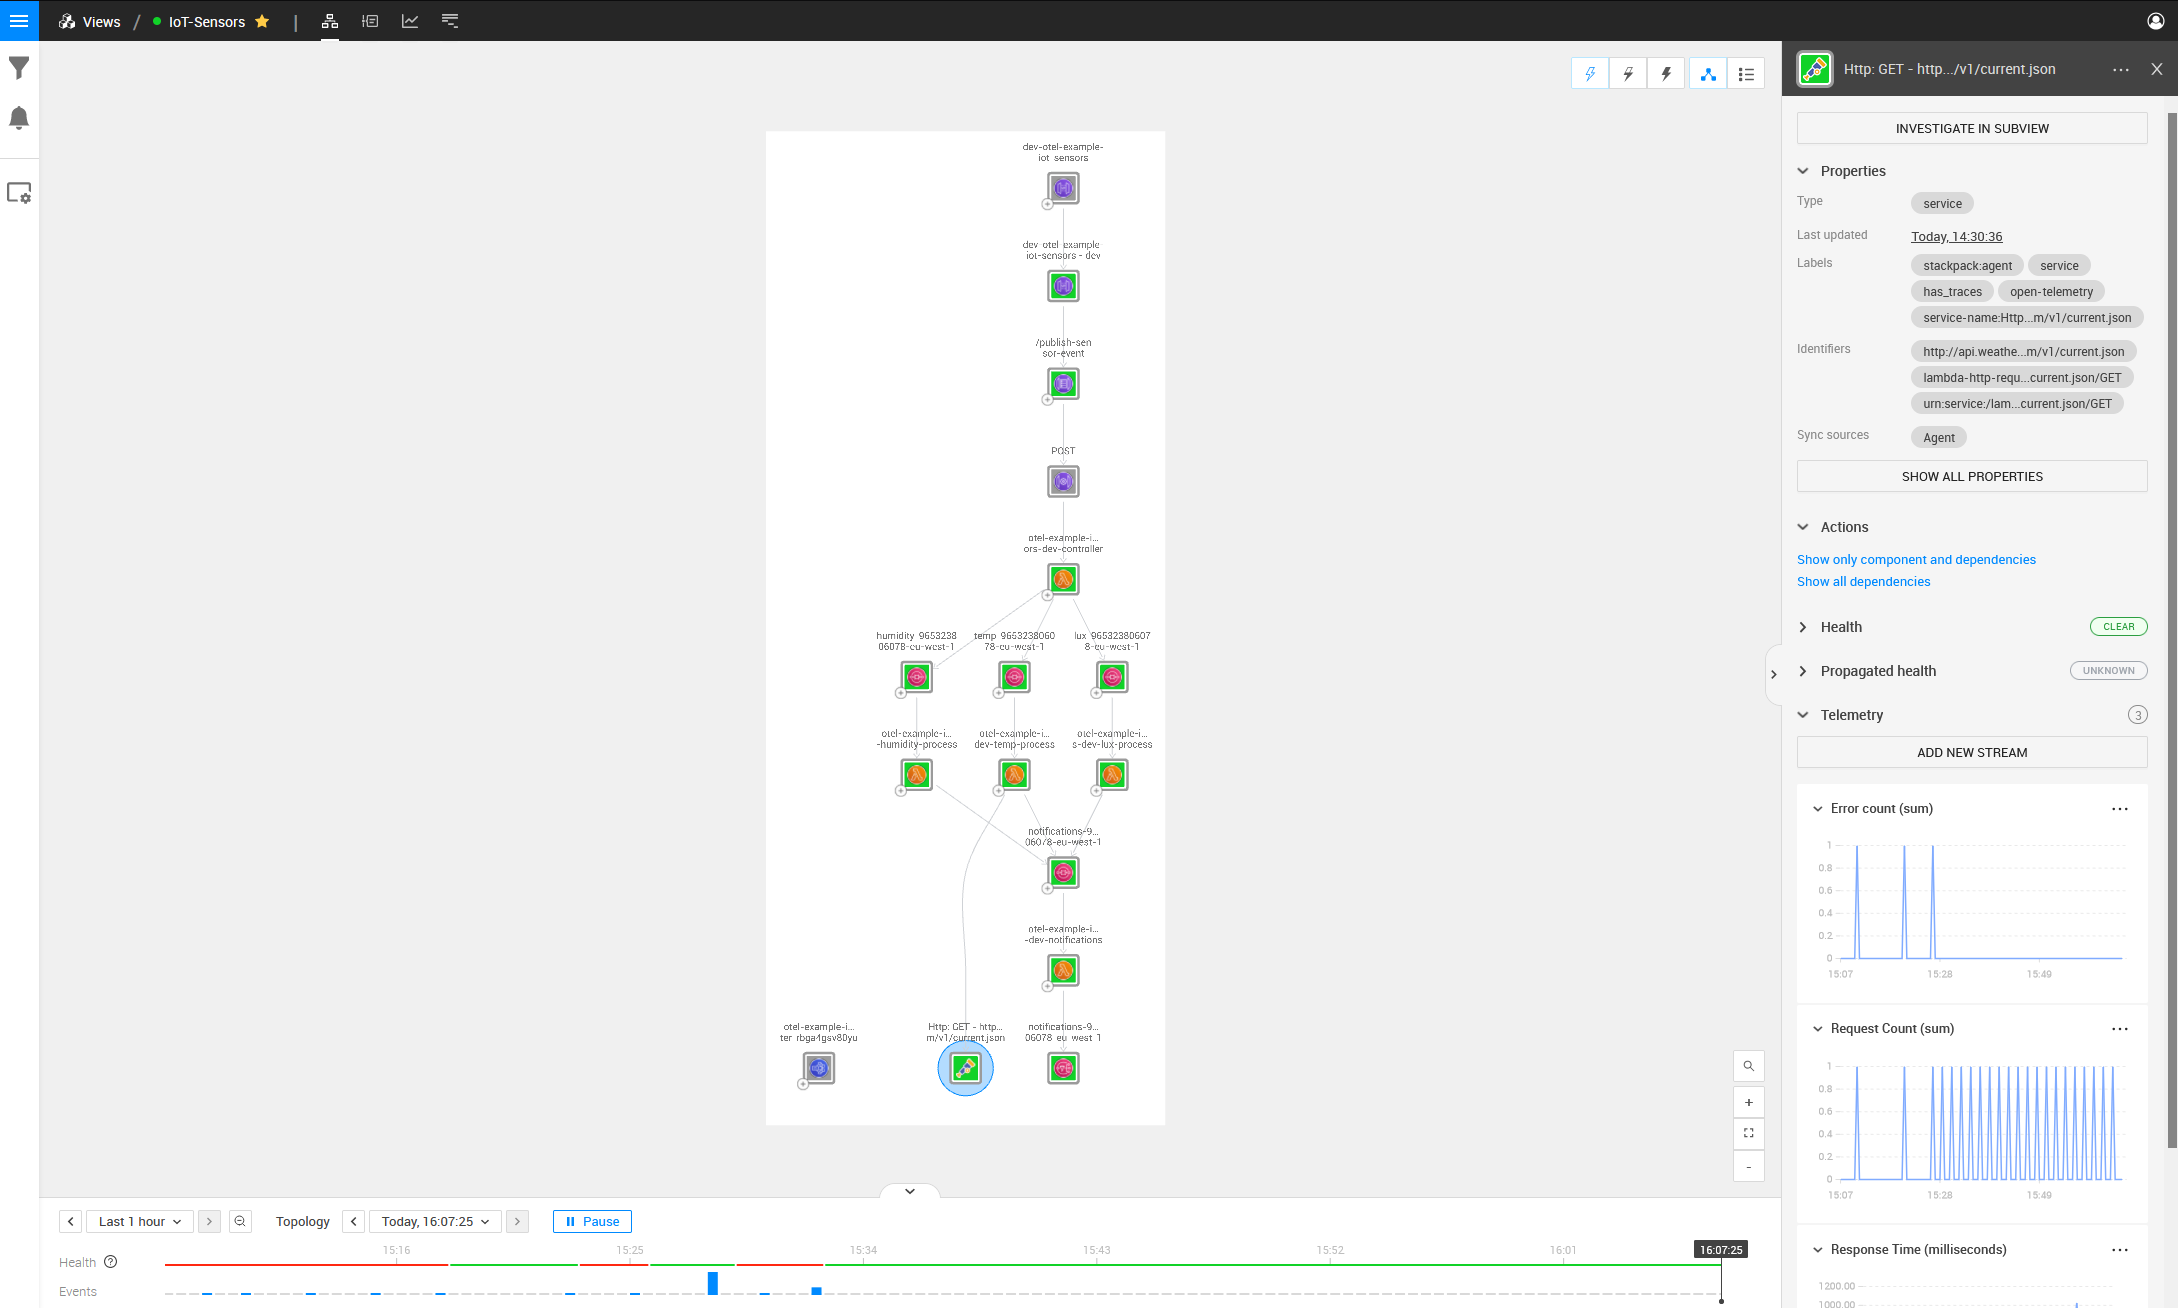
With the Lambda environment variable “OTEL_EXPORTER_OTLP_TRACES_ENDPOINT” pointing to our StackState agent, we can see the complete topology and relations when our AWS Lambdas attempt to communicate with any AWS services. After waiting for the initial sync, we can visually see the problem introduced above (a red center indicates a component is broken). The image below contains the same architecture as displayed above but with OpenTelemetry in the mix. We can clearly see a lot more relations.
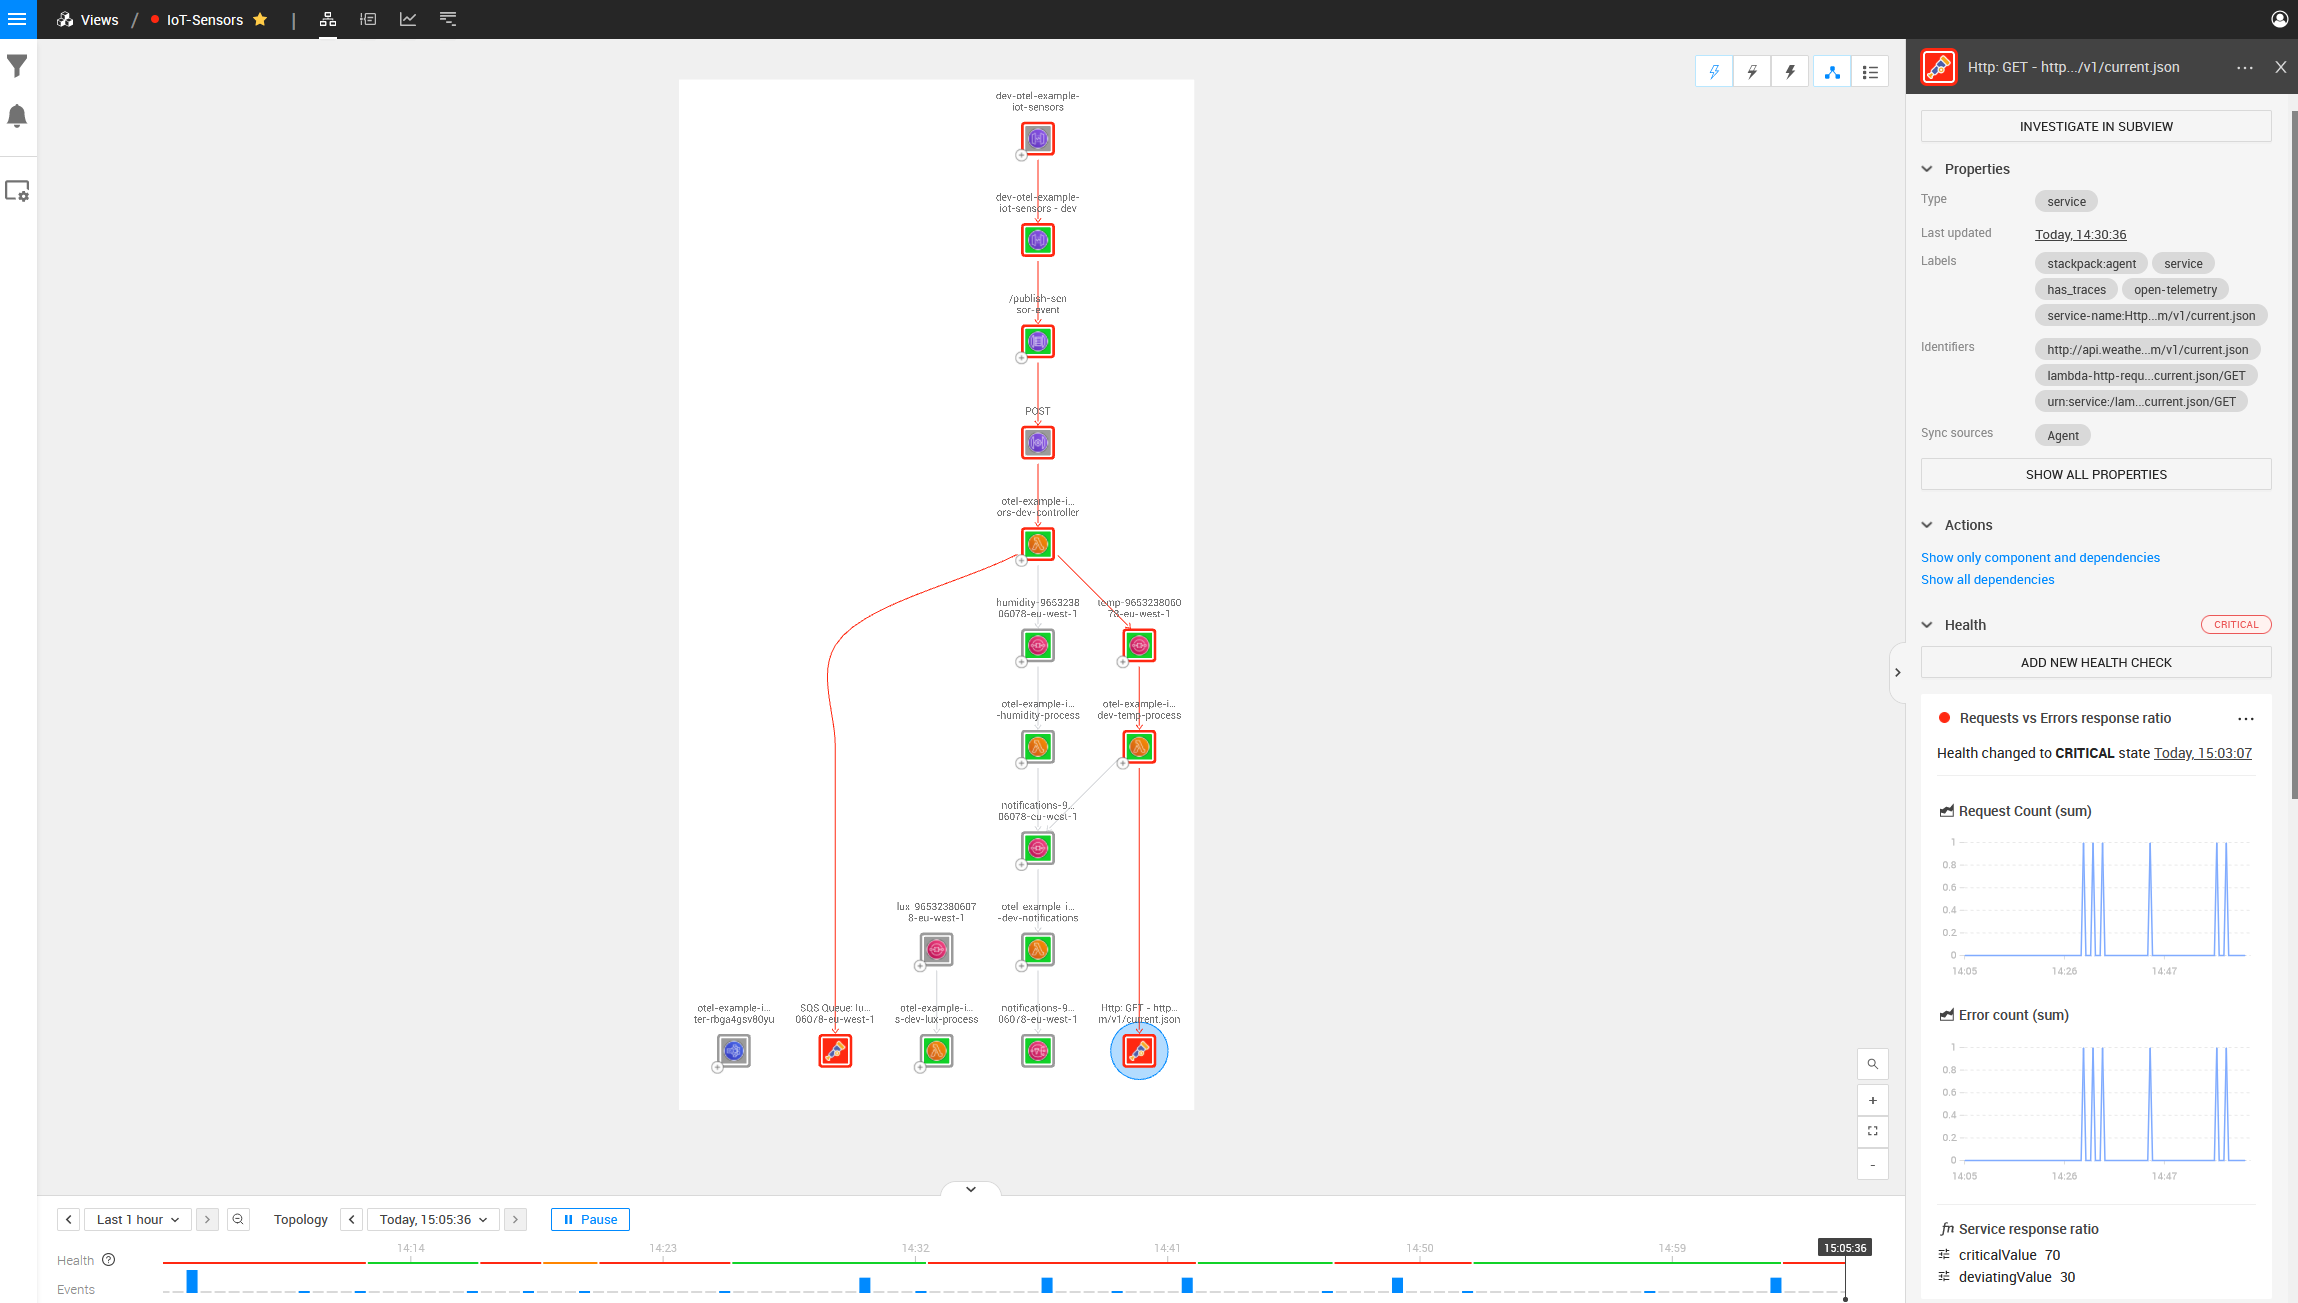
Looking at the Temperature AWS Lambda function, we can also see the endpoint that it is talking to and we can see an error occurring on that point (indicated by the red block around the component).
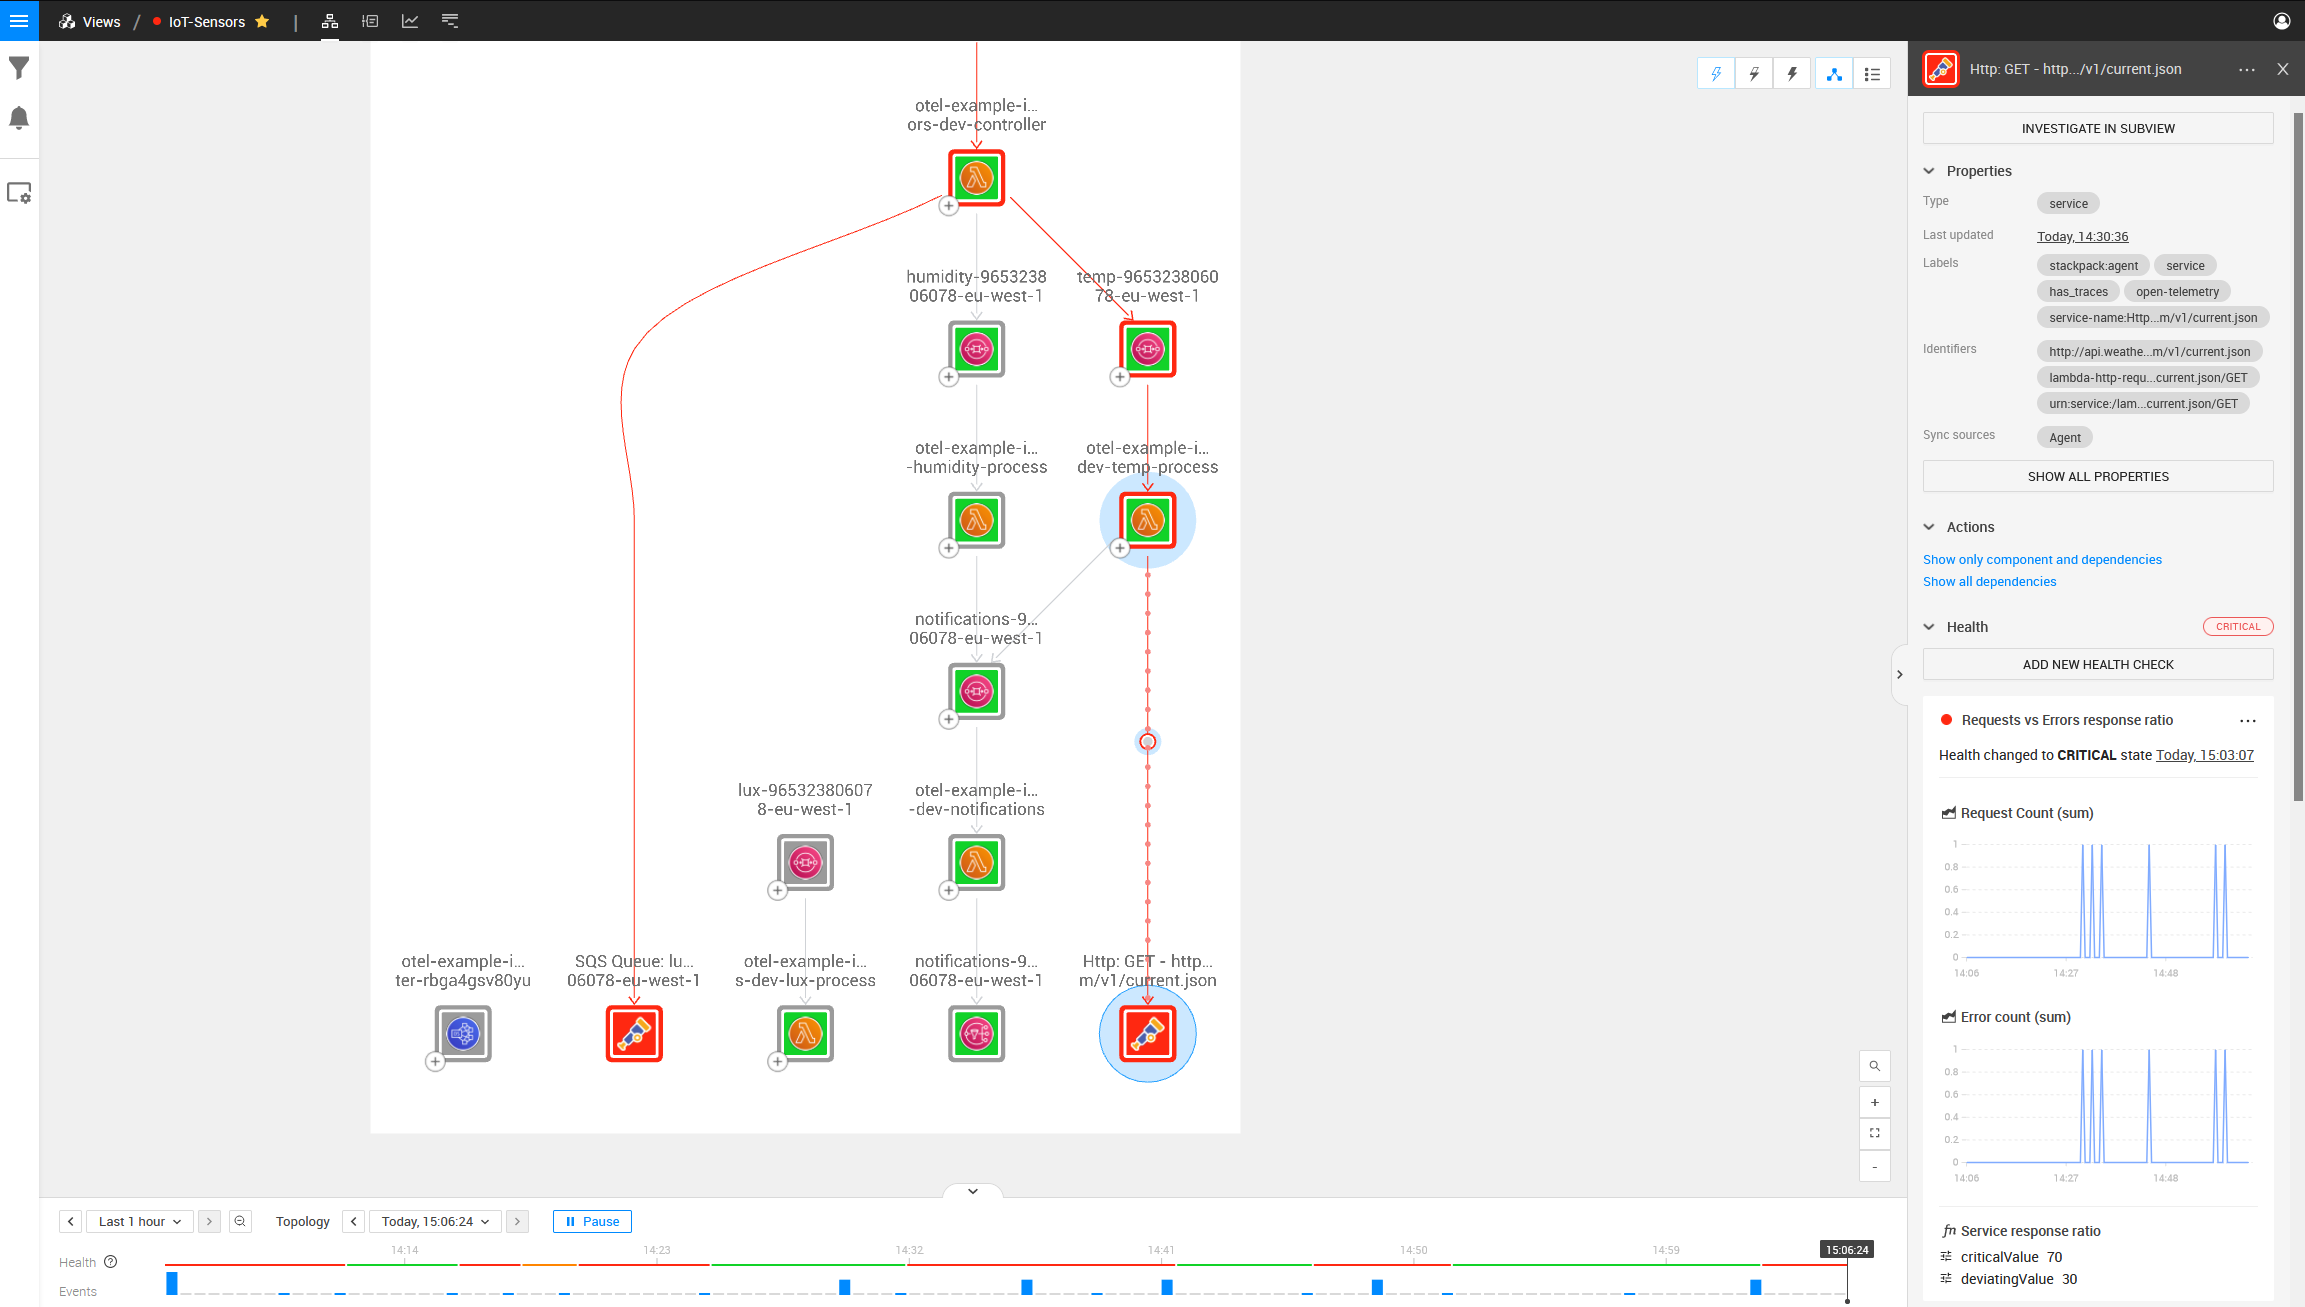
We can also see no communication between the Lux AWS SQS Queue and the first AWS Lambda function by looking at the Lux SQS and Lambda components and noticing that there is no dependency between them.
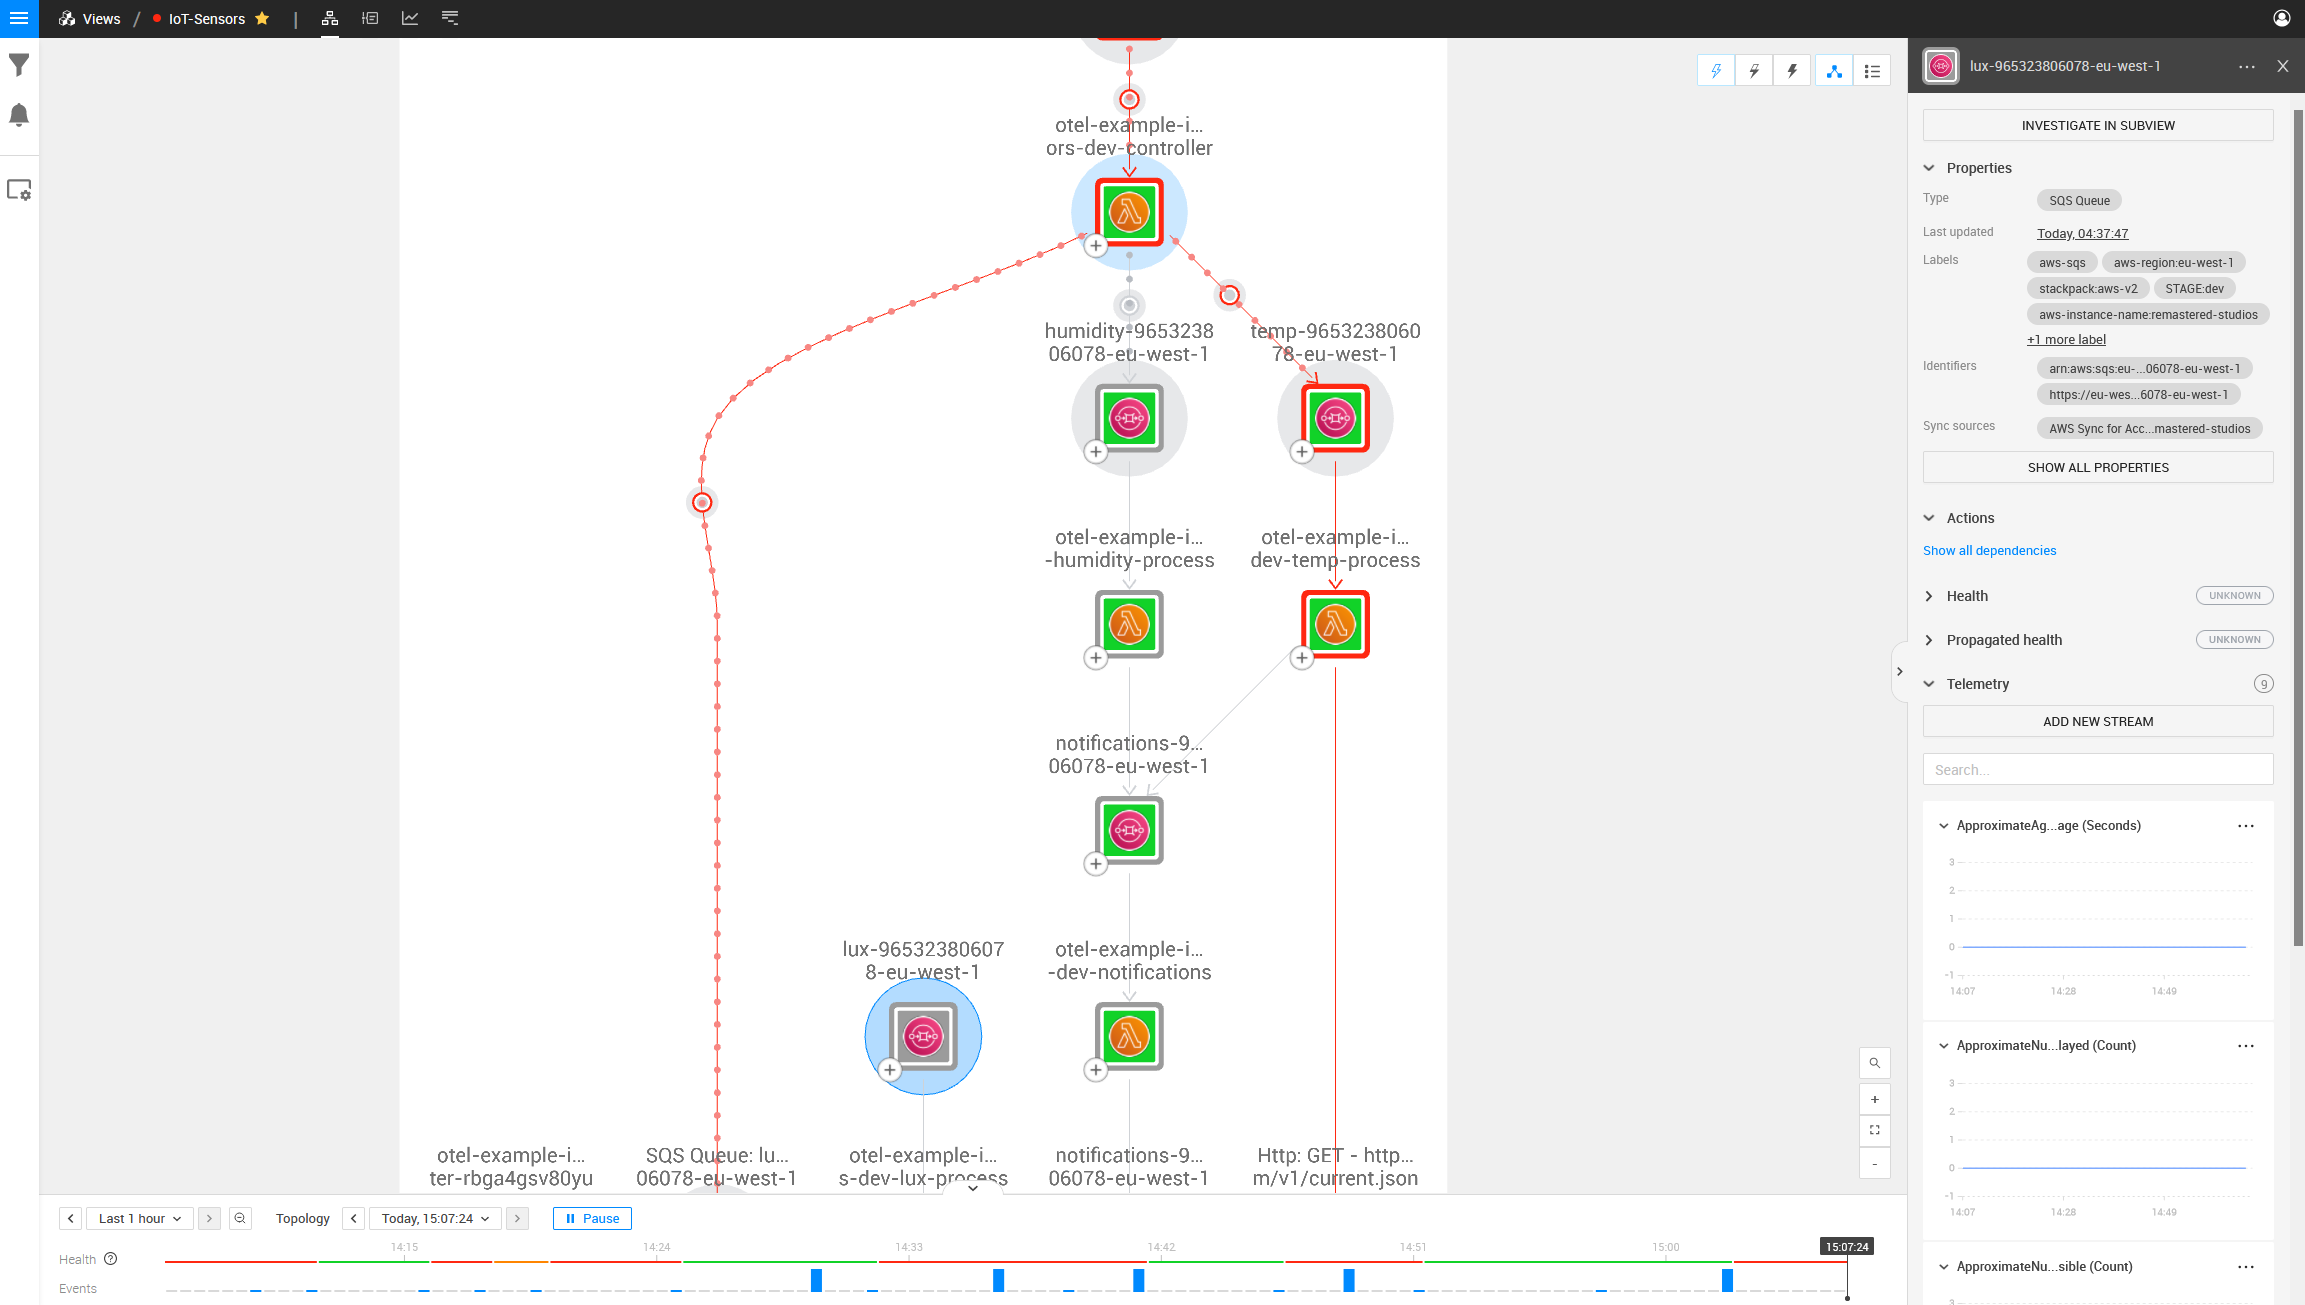
On the left side is also a component that is mapped with OpenTelemetry but does not look the same as the other SQS Components in the topology: it is a component this Lambda is talking to, but one that does not exist in your AWS Stack.
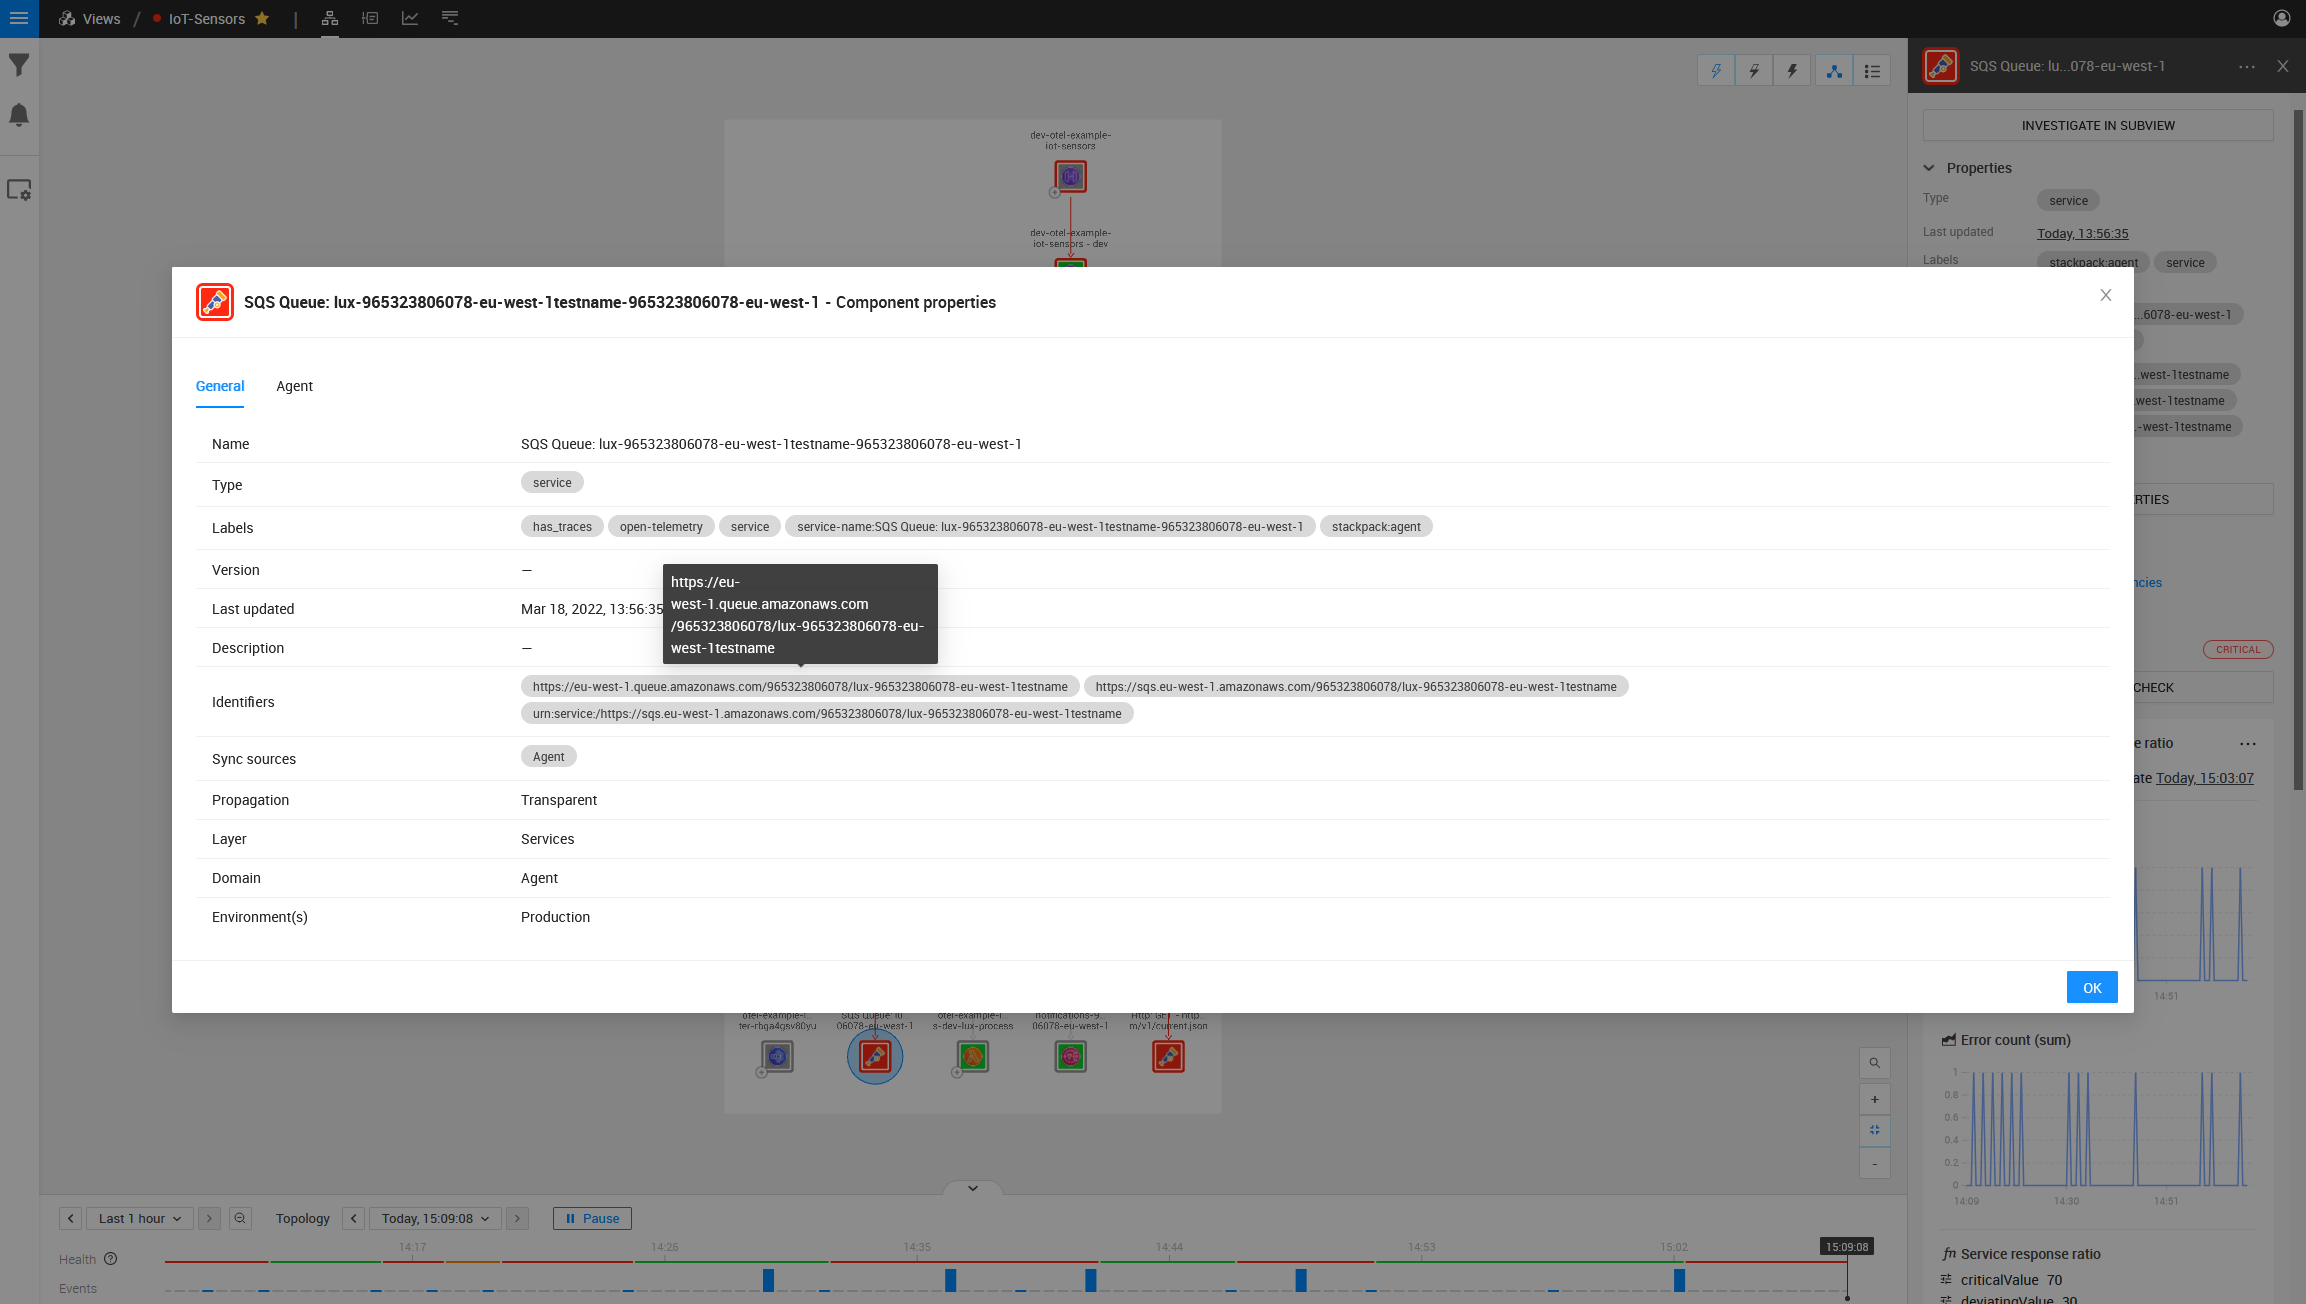
Investigating this component, we can see the ARN is incorrect.
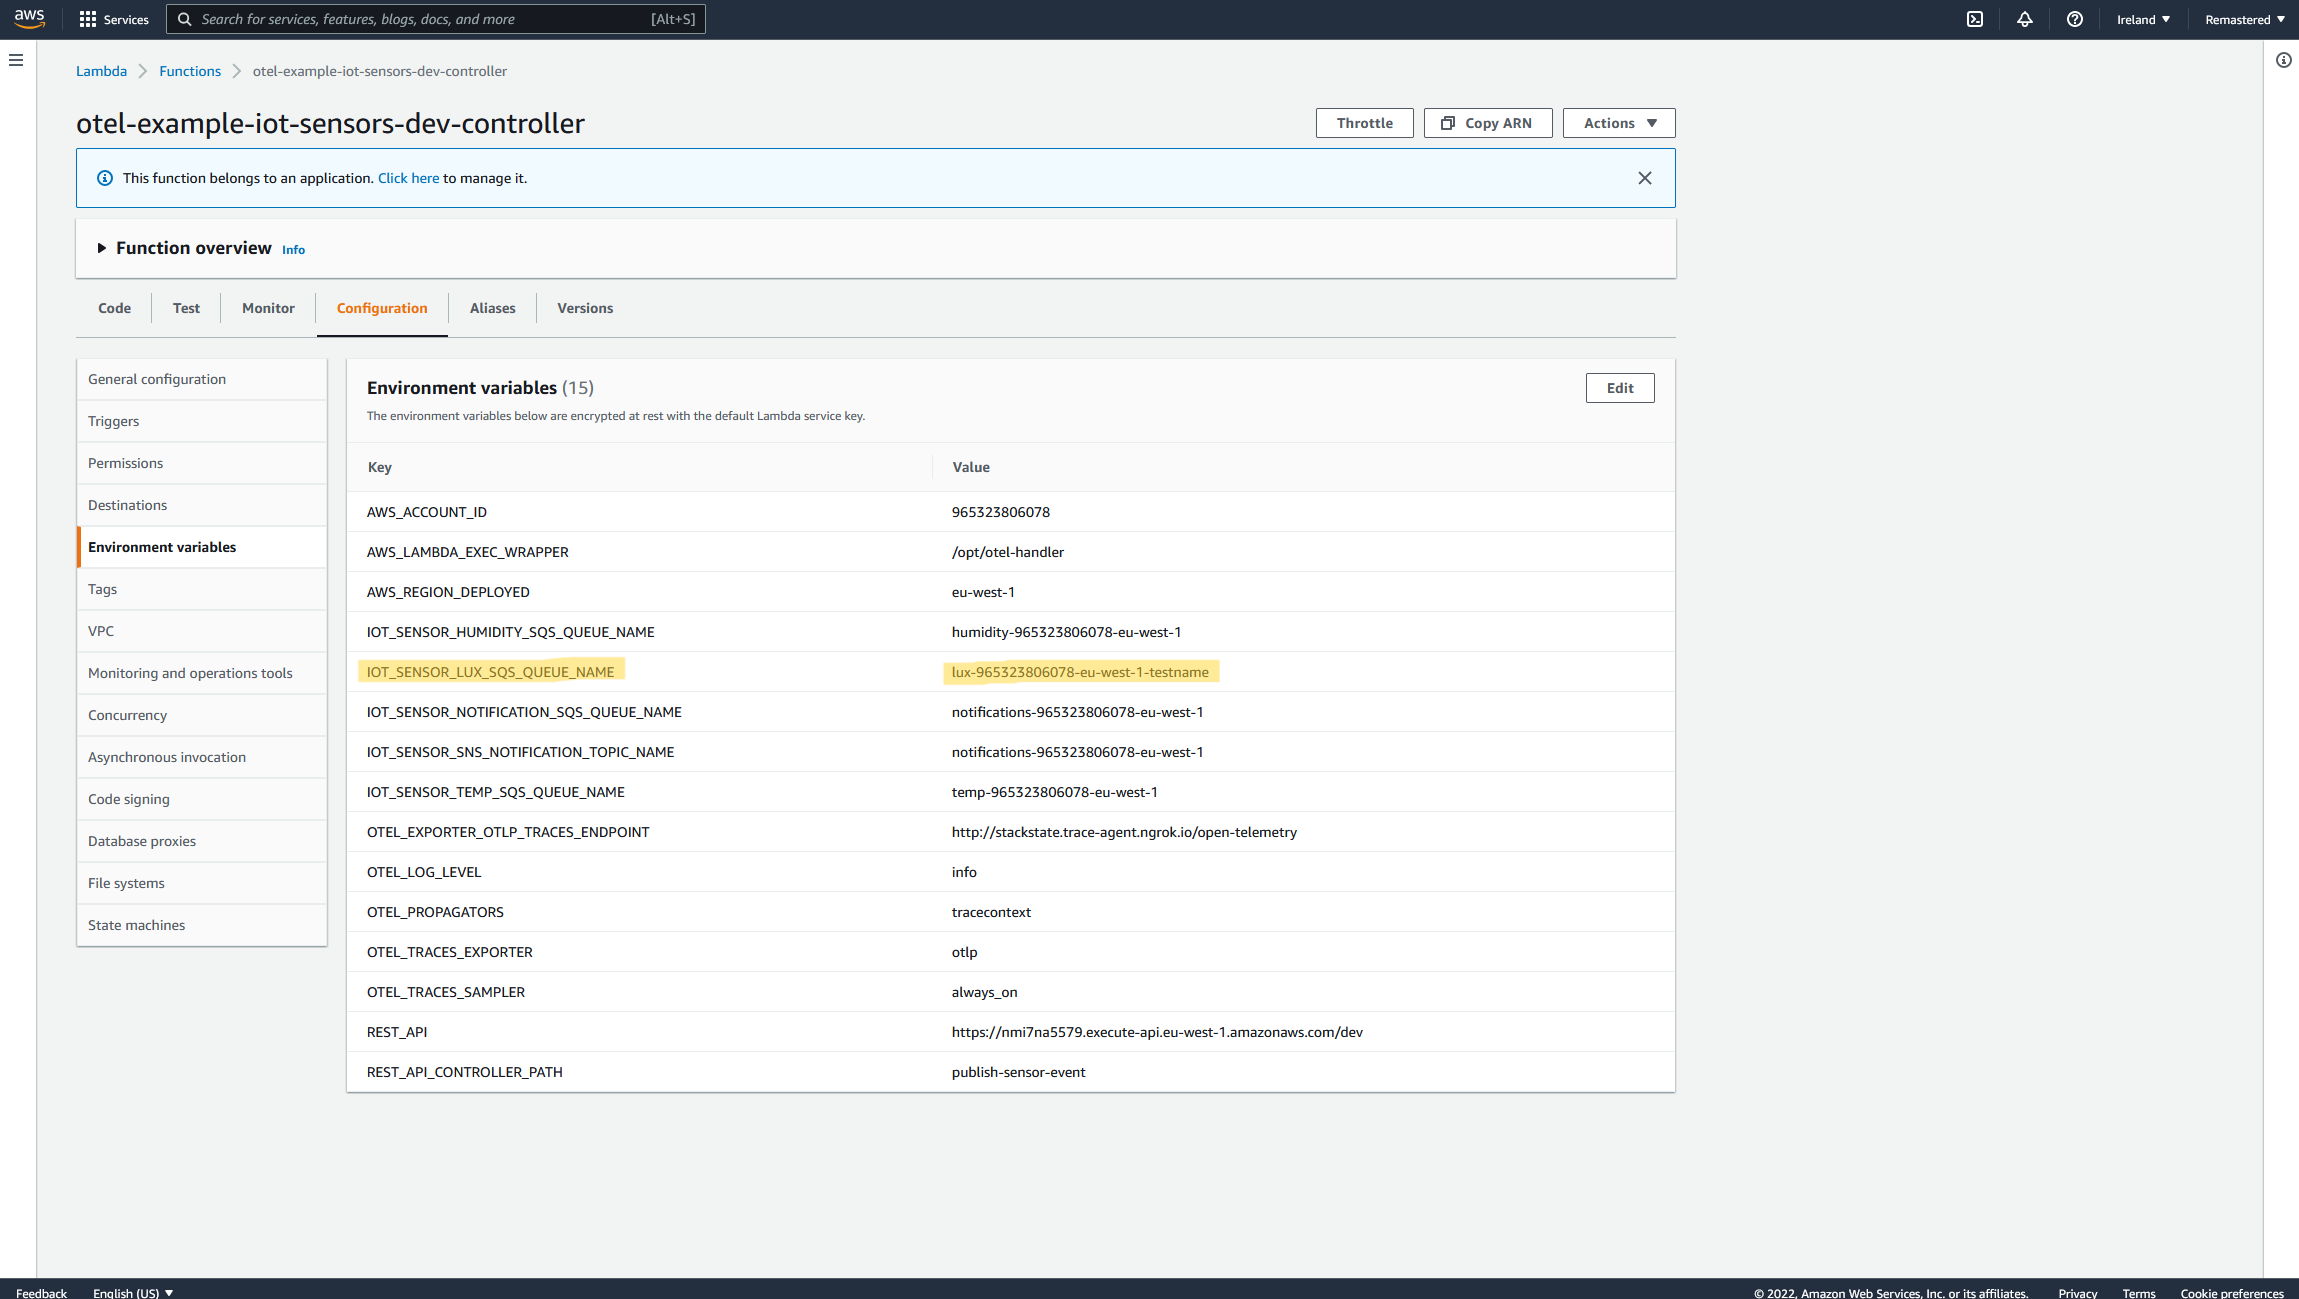
Now let’s attempt to fix the root cause of the problem displayed above. Let’s update the SQS Queue name for the Lux Queue to remove the invalid text at the very end.
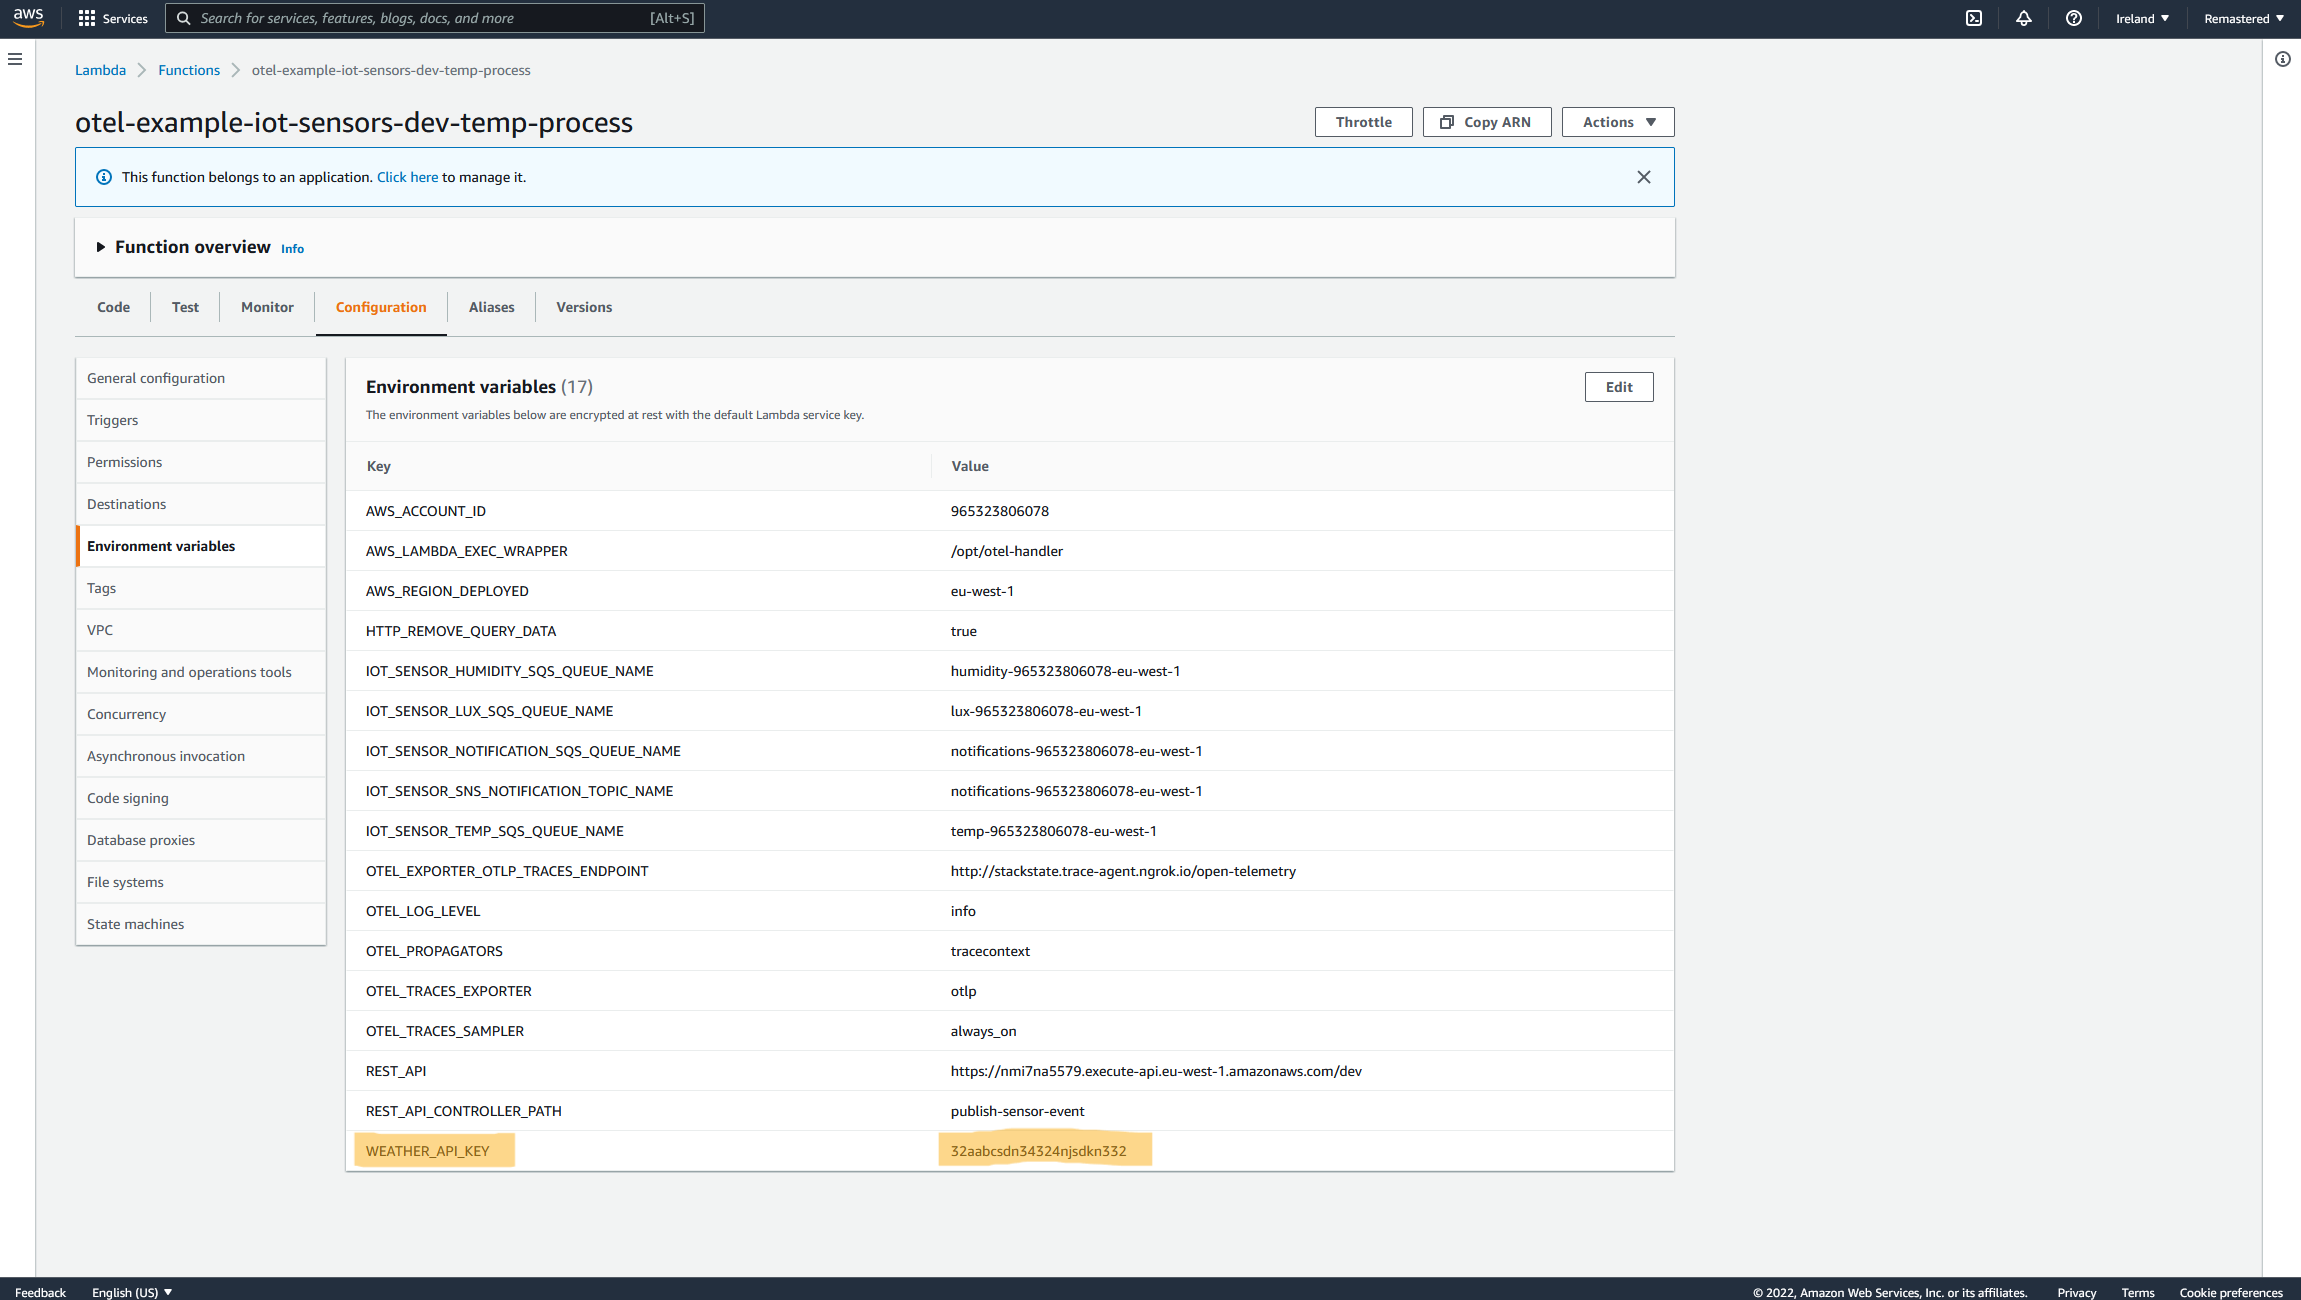
And let’s also update the Weather API Key to use the new valid API key.
After a few minutes, we can see the new health state propagated through the entire system, and both the problems that existed within the Lambda Scripts themselves are fixed and working correctly.
The best part of OpenTelemetry running on StackState is that I have the freedom to deploy updates to my Serverless template and freely deploy and integrate things. StackState then assists me so that the debugging of my Lambda function requires less work and fewer headaches to find problems. I can see if my function attempts to communicate with the wrong service or is receiving any error communicating with that service or endpoint.
Also, a cherry-on-top is that my Lambda script does not even have to fail with a 400 status code. Even if the Lambda script still runs with a successful 200 state, the OpenTelemetry functionality still picks up if communication fails within the script with certain x and y services.
Now watch the video in action!
In short
The visibility given by StackState paired with OpenTelemetry is genuinely astounding. It relieves some of the pressure and weight presented by not having profound knowledge about an environment, and StackState also makes misconfiguration more noticeable without digging into code.
The platform shows you relationships between various services and how they are communicating, where and at what time a root cause started, and if anything changed over time, thus making debugging a lot more convenient.
Want to learn more about StackState and OpenTelemetry?
Watch a webinar to see how StackState’s topology benefits NN Bank


