Companies depend on observability insights to provide reliable online services to their customers. To support their efforts, StackState is proud to announce a new version of our unique topology-powered observability software, StackState v4.6, available now. This new version brings powerful new capabilities to DevOps and SRE teams who need to maintain a deep understanding of how their stack is behaving to meet their SLOs:
Delivers compelling enhancements in our topology visualization that accelerate troubleshooting.
Adds support for OpenTelemetry traces, specifically for serverless AWS Lambda applications built with Node.js. Using this new low-latency data requires no integration and it immediately enriches your topology with additional relationships and telemetry.
Expands our autonomous anomaly detection capabilities to automatically analyze the golden signals of throughput, latency and error rate, conduct automatic health checks and alert you when anomalies are found. Now you can find the root cause of incidents more quickly and be more proactive in preventing problems from ever occurring.
And many more enhancements!
Richer, More Flexible Visualization and Troubleshooting
StackState already has the most powerful dynamic topology visualization capabilities in the industry. You can view the relationships and dependencies across your IT environments at any granularity, from a high-level business service perspective down to a very low component-level view. It’s easy to navigate through our topology visualization to see the effects of changes on any service at any time, and to slice and dice your topology to focus on what’s important for you and your team.
StackState’s topology lets you click to go directly to the probable root cause of an issue, and it exposes how changes or anomalies in one area can impact business services across the environment. With the v4.6 release, StackState introduces more contextualized information, more intuitive usage, faster access to information and easier troubleshooting.
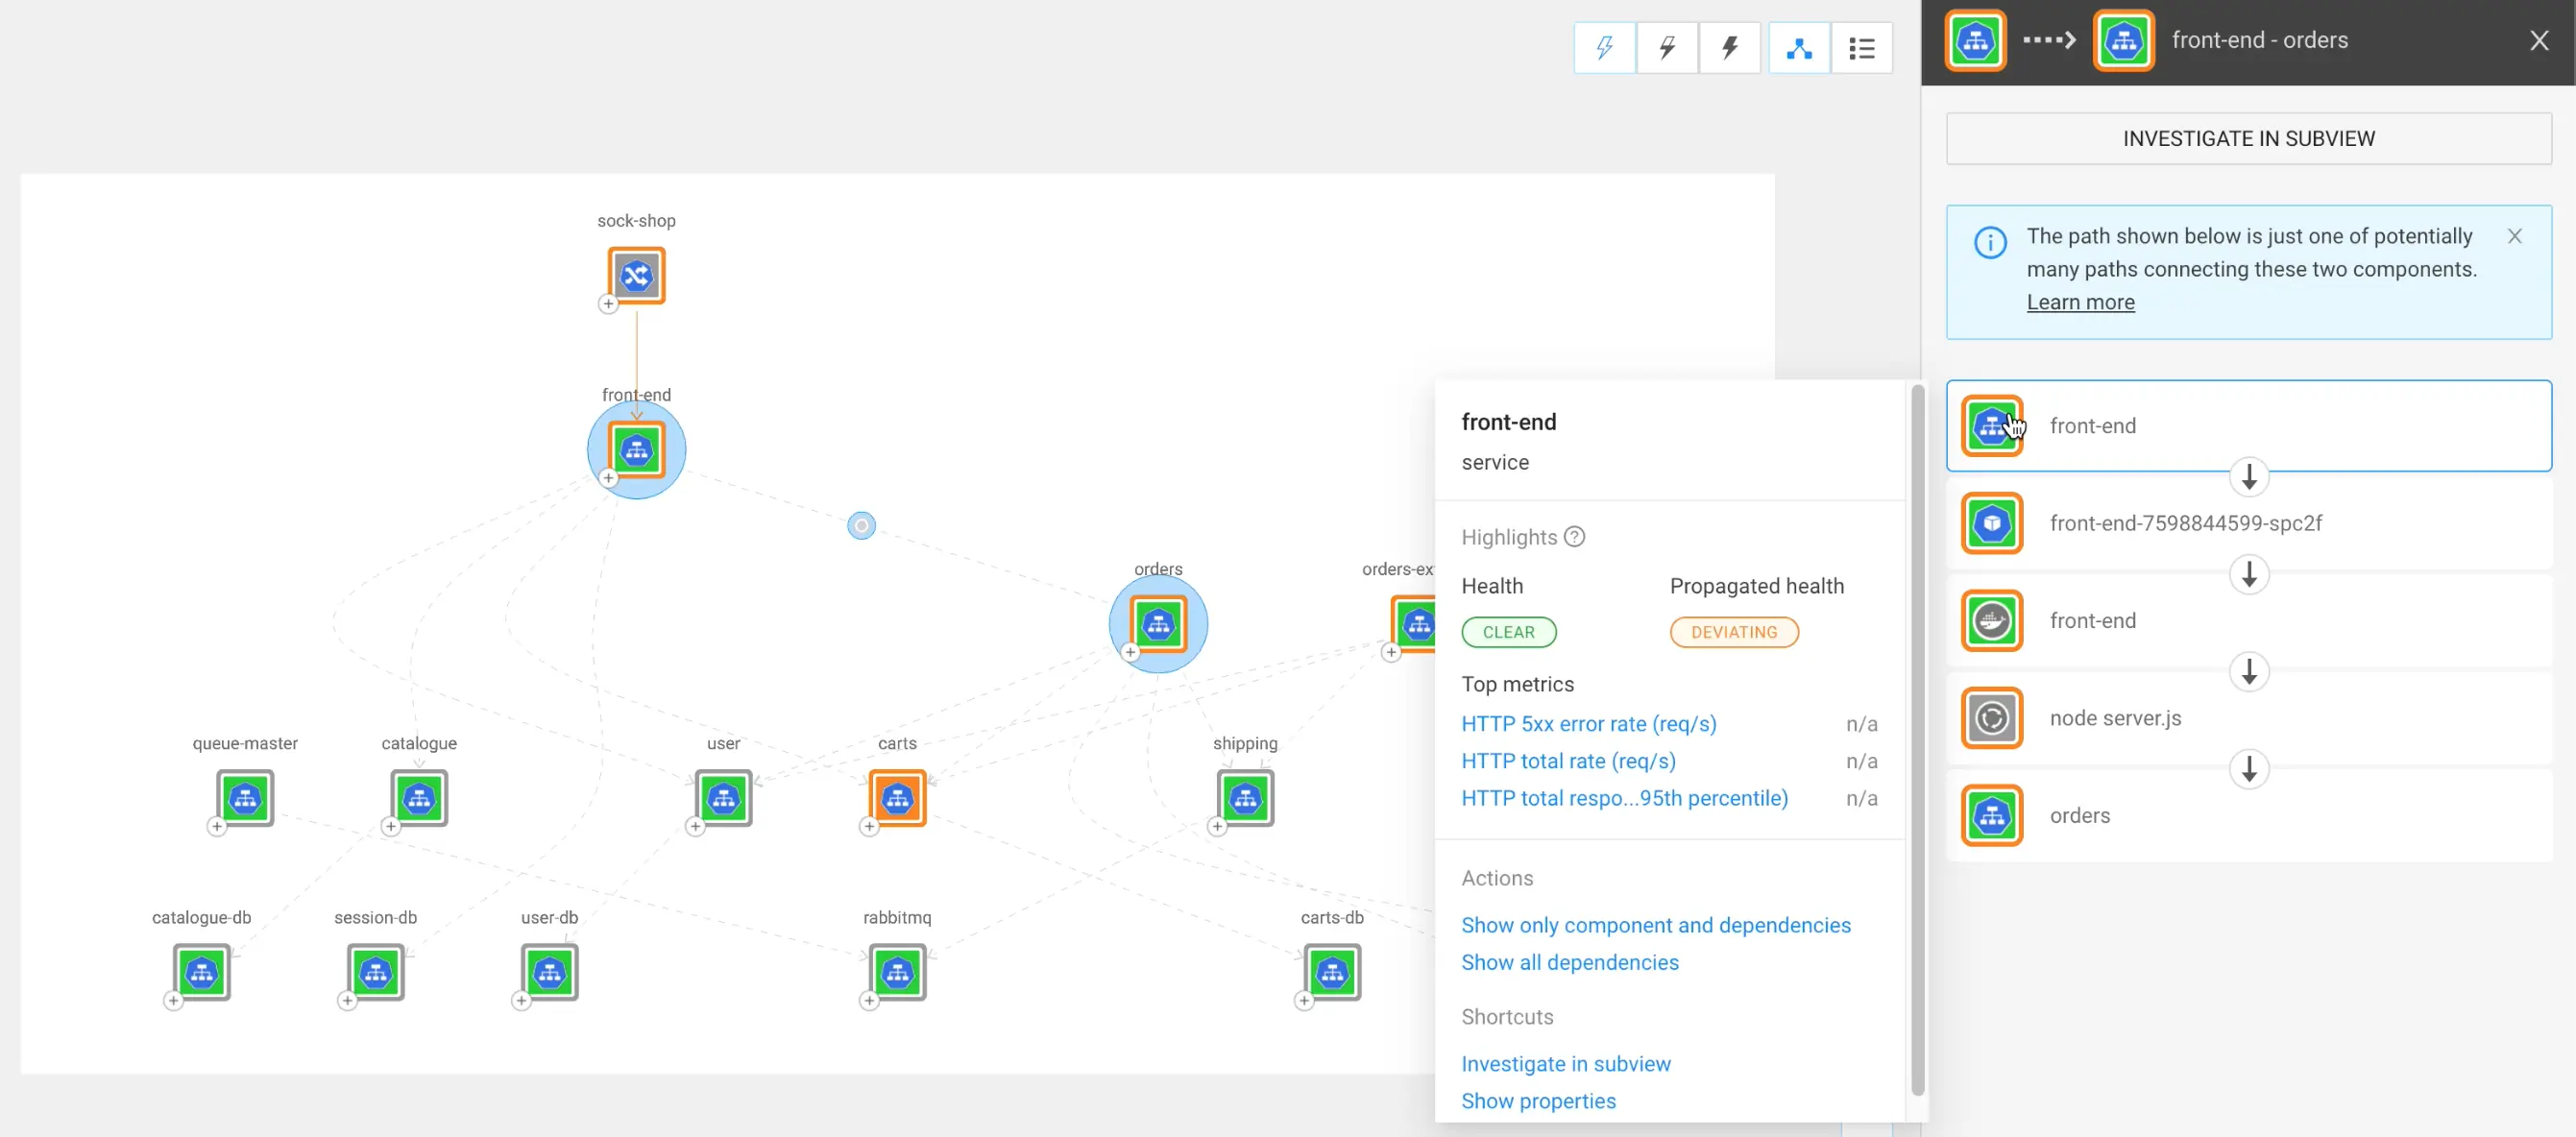
Now you can hover over a component to immediately see key metrics, make fast assessments, act proactively and, when necessary, troubleshoot faster than ever. For example, you can now tell that a component is failing or that response time is increasing without clicking or changing views.
If you have a complex topology, in StackState v4.6 it’s much easier to discern the direction of dependencies at a glance, investigate incidents and gain a deeper understanding of your environment. Additionally, if you are changing architecture and want to add extra services, you can easily see how everything is connected. It’s also easier to share all of this knowledge with your colleagues.
Support for OpenTelemetry Traces: A Core Foundation to Observe Serverless Applications
As technologies become more complex and more dynamic, their stacks become harder to observe. Serverless applications present particular challenges because their infrastructure is completely dynamic, they are even more granular and complex than their ever-shifting, container-based cousins and they have many dynamic dependencies.
Teams need a way to build an understanding of serverless environments so they can build serverless applications faster, as well as effectively troubleshoot them. They need a deep, structured, context-aware representation of the entire environment as it changes over time, one that provides insights at the business level and at the component level. OpenTelemetry, combined with topology data collected over time, is a core enabling technology for creating reliable serverless applications.
With StackState v4.6 we are adding support for OpenTelemetry traces, specifically for serverless AWS Lambda applications built with Node.js.
Our new OpenTelemetry support for traces enriches your topology with these additional relationships and telemetry. OpenTelemetry trace data is immediately available with low latency and no integration. As always, you can see the state of your stack – which components exist and how they are performing – at any point in time.
Expanded Autonomous Anomaly Detection Predicts Incidents
Last year StackState released our innovative Autonomous Anomaly Detector, which uses machine learning (ML) to analyze behavior patterns in your environment. By combining data from our Autonomous Anomaly Detector with our rich topology data and our 4T Data Model, StackState helps you quickly locate the root cause(s) when incidents happen and also highlights anomalies that may turn into problems later.
With StackState 4.6, we are adding automatic Kubernetes health checks and alerting to our zero-configuration anomaly detection, which works out of the box and delivers results in just a few hours. StackState now autonomously analyzes incoming data streams and looks at the golden signals of throughput, latency and error rate to find patterns, conduct health checks and automatically alert you if metrics start to deviate from desired behavior.
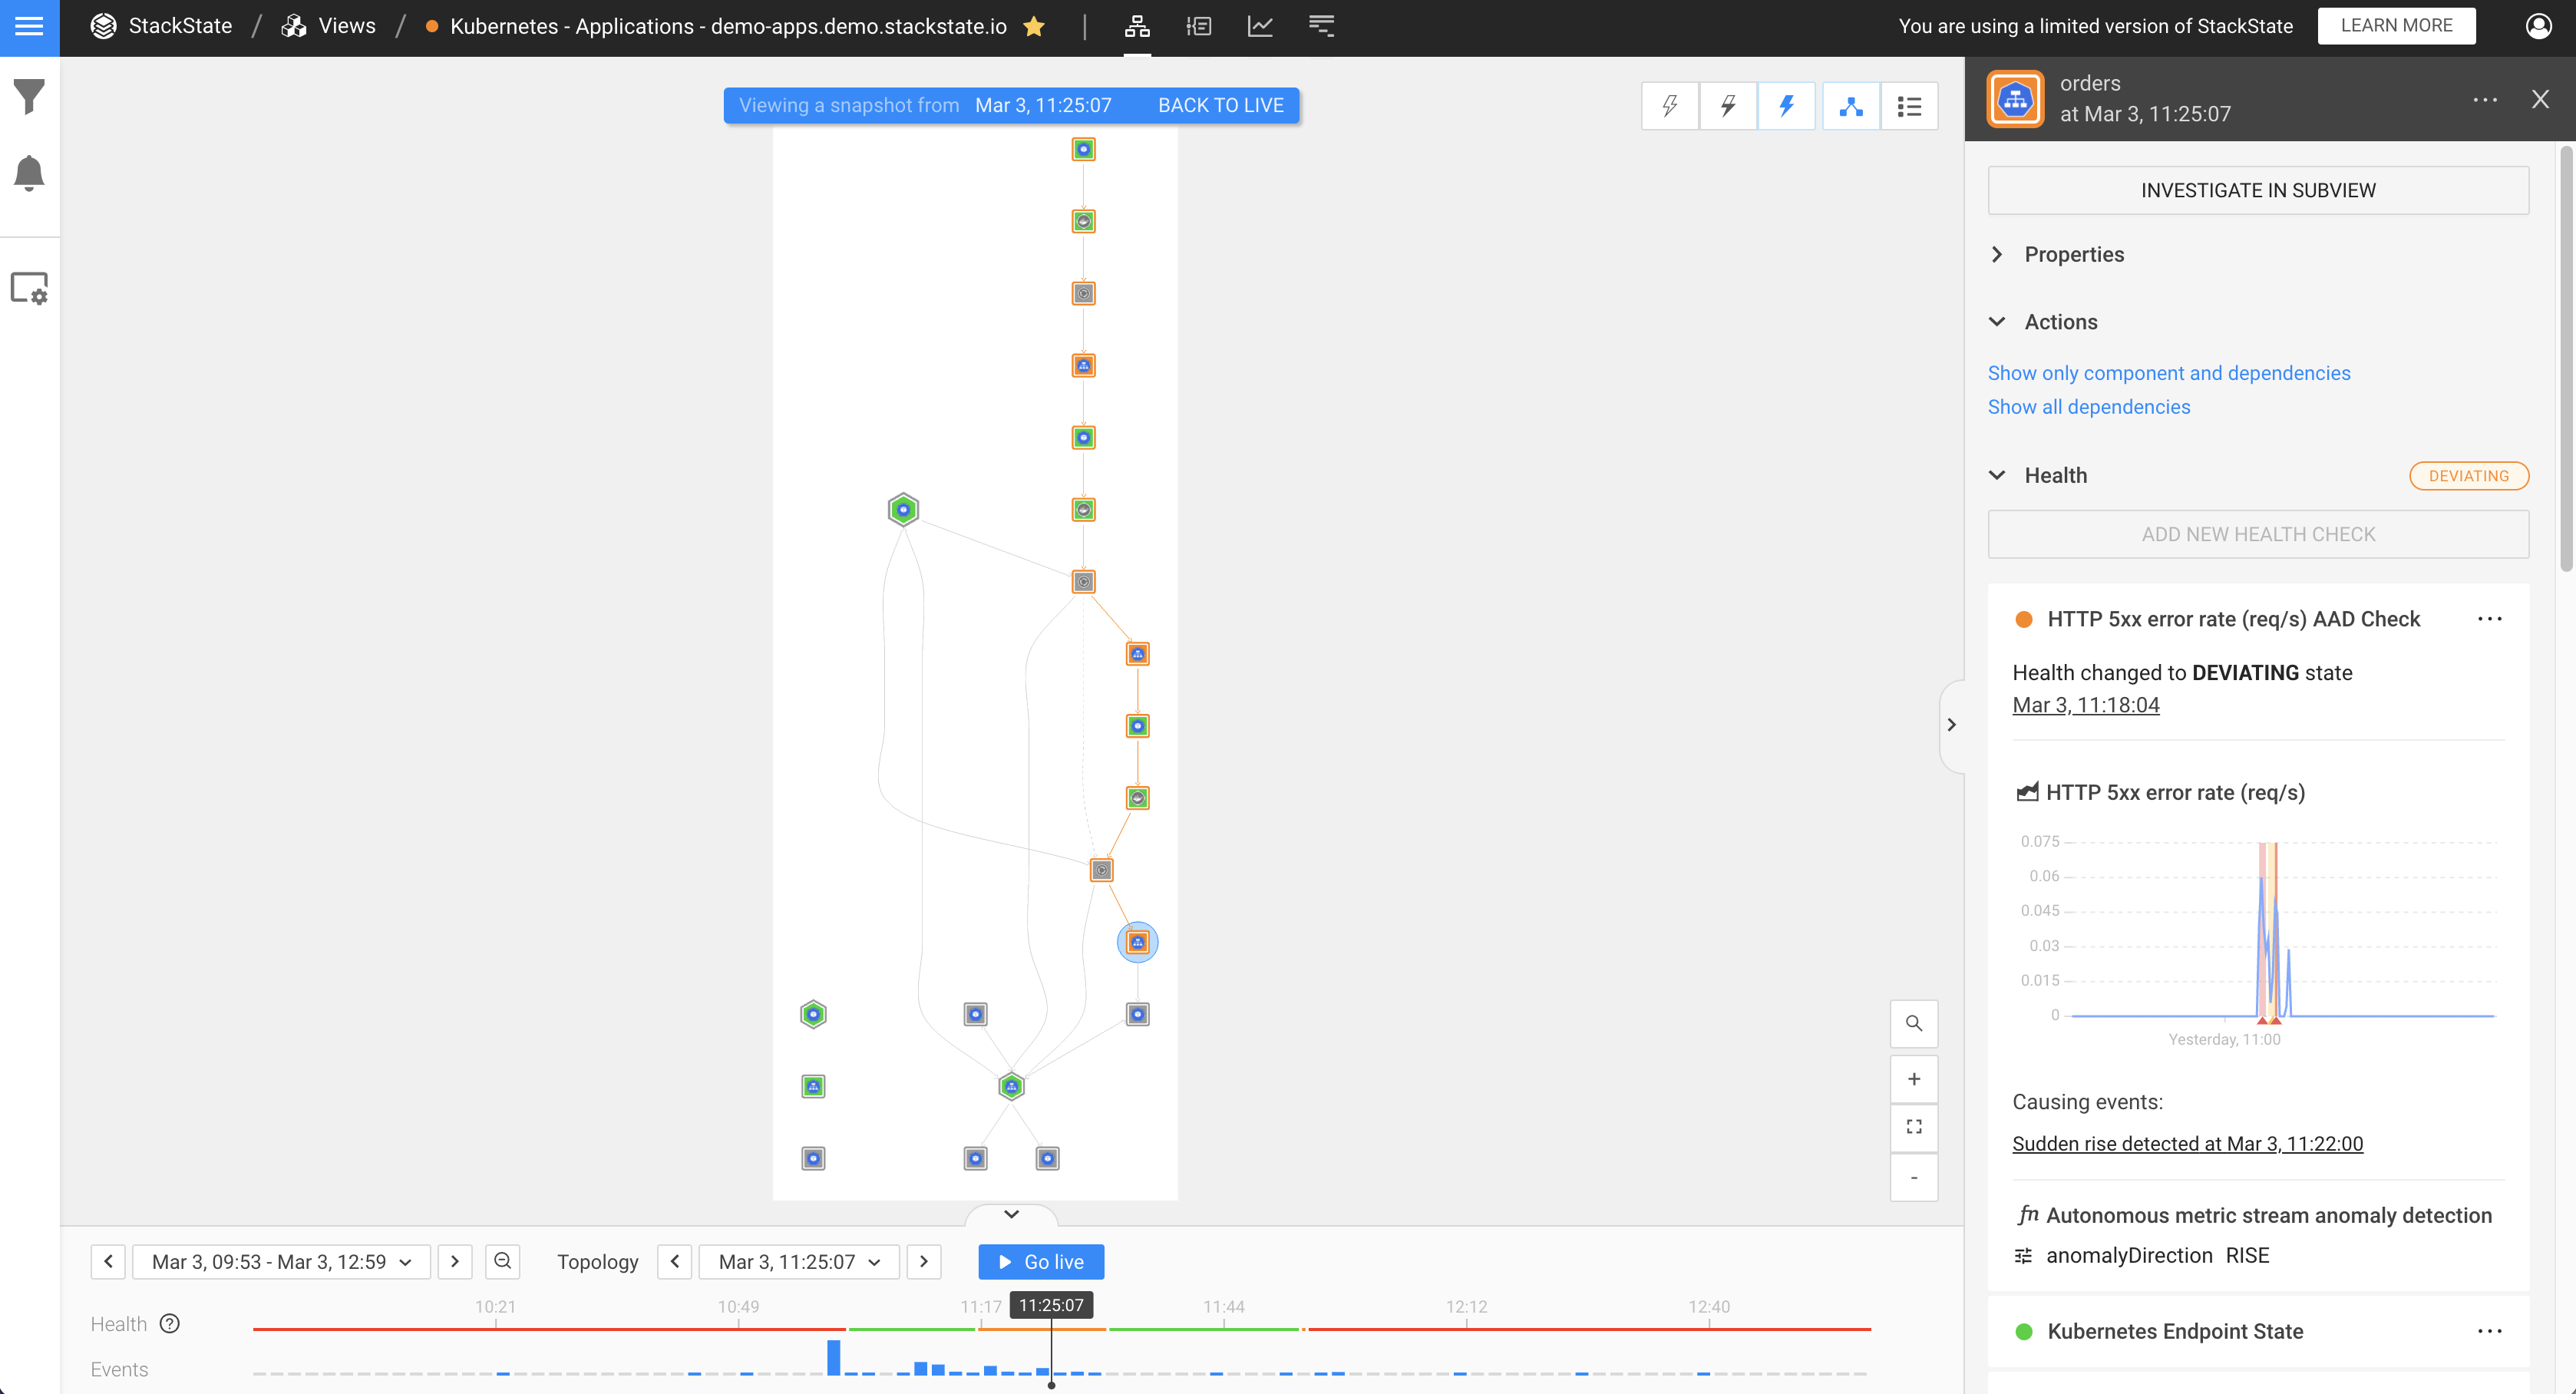
The expanded anomaly detection in v4.6 also further strengthens our strong root cause analysis, by linking suspicious behavior with probable causes in the overall environment. Combining data from our Autonomous Anomaly Detector with our comprehensive topology data and our 4T Data Model, StackState v4.6 delivers the fastest and most accurate root cause analysis capabilities available so you can react quickly. It now also provides richer incident prevention functionality, by delivering early alerts and then visualizing how anomalies will affect dependent business services. You can use this information to set priorities based on business impact, bring in the right people to take action, and proactively prevent problems altogether.
If you already have StackState, don’t wait to upgrade to v4.6. You’ll find release notes and instructions here .
If you haven’t tried StackState, now is a great time to get a demo from an expert.
And if you want to learn more about StackState on your own:
Read our StackState 4T Data Model solution brief
Watch the recent webinar, Driving Business Performance With Observability in Financial Services, featuring StackState customer Sander Vijfschagt from Nationale-Nederlanden Bank, Mitch Ashley of Techstrong Research and myself.


