
With observability practices maturing steadily in every organization, it’s time to rethink how to utilize all the data that is collected for monitoring and observability purposes. It’s time to reconsider how to increase the reliability of your IT environment and reduce downtime for your end customers. With our new 4T Monitors, StackState takes a big step forward in enabling you to harness all the knowledge that is already generated and collected.
Observing topology with topology monitoring
StackState’s 4T Monitors add a new dimension to the traditional telemetry-based monitoring capabilities – topology. Topology is a map that describes the set of relationships and dependencies between discrete components in an environment. It makes invisible connections visible and provides anchor points to connect data streams.
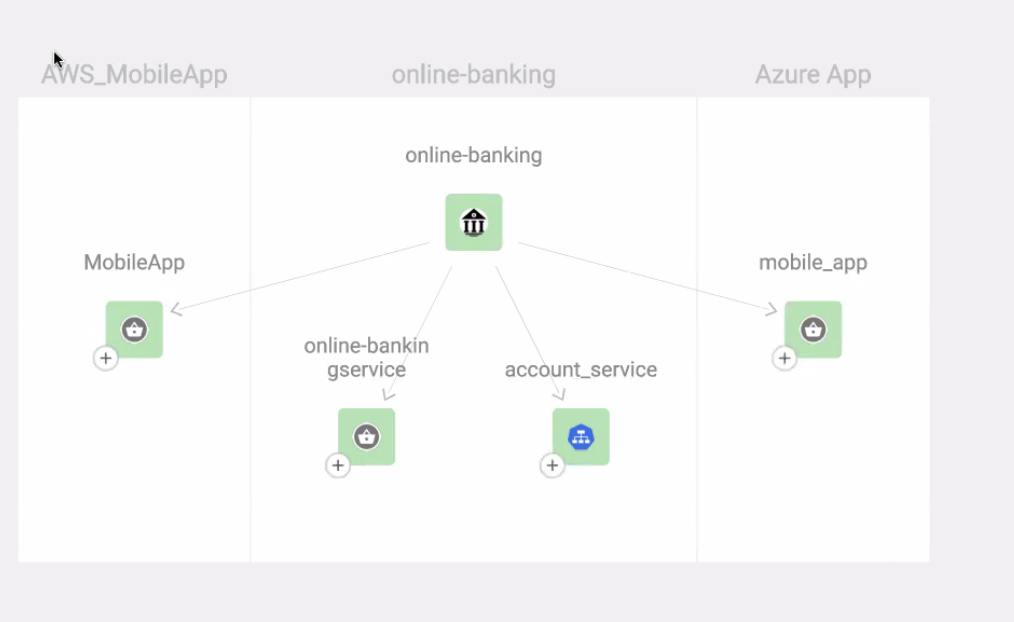
A very simple example of topology.
StackState users now have the option to define complex validation rules leveraging monitored metrics, logs, events, traces, topology properties and external data sets, as well as the structure of the topology itself. 4T Monitors provide ways to access and combine this data in novel ways while minimizing restrictions on how the logic of the various checks can be expressed.
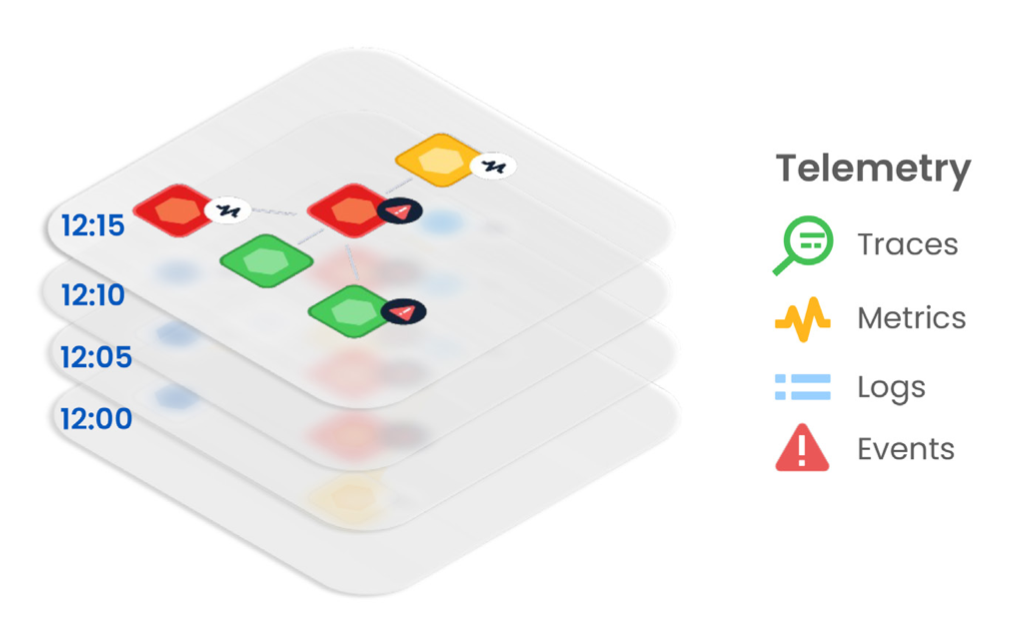
Observability data collected, unified and correlated, over time
At the core of StackState is the 4T®Data Model, which allows Topology, Telemetry and Trace information to be correlated and stored over Time. The ability to correlate telemetry information with topology and trace data allows the creation of advanced monitoring rules that continuously validate if your system is in the right state.
With our new 4T Monitors, StackState becomes the first platform that can observe your topology. Now you can trigger alerts based on changes in topology structure, topology metadata, metrics, events and any combination thereof. Monitors use the full suite of 4T data to give the most insightful and accurate indications available.
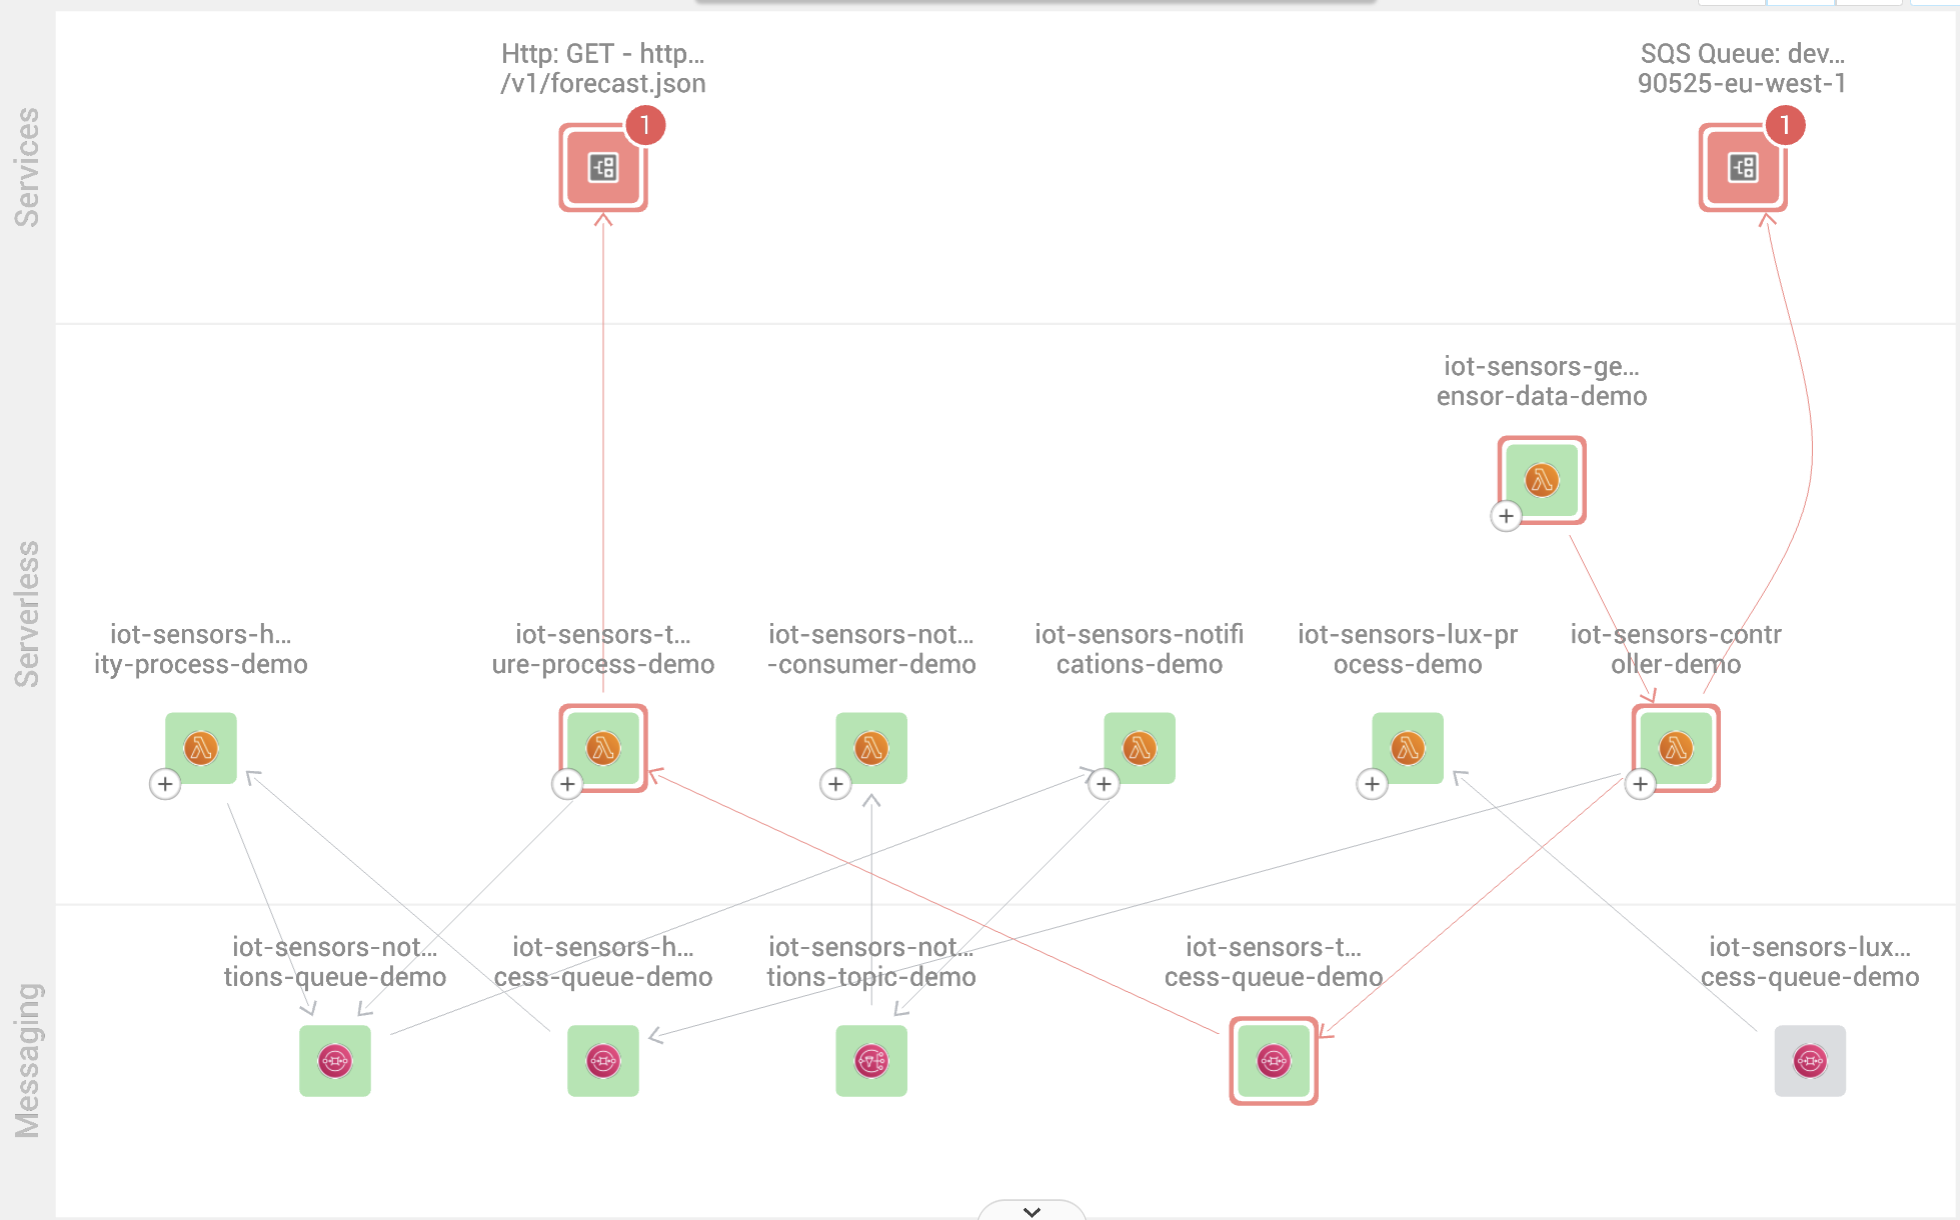
Monitor all your topology and telemetry with 4T Monitors.
Why using 4T Monitors will drive more stability
Companies might struggle with improving the reliability of their services. There are several reasons for this, and our new monitors can help solve these issues.
You don’t have enough skilled observability/SRE experts on your team to define the right monitoring rules: Through our new monitors, companies can articulate a monitor once and apply it across all their teams and environments. In fact, our 4T Monitors can be defined as code so you can more easily apply, share and maintain them.
You lack a holistic picture of how all components are connected and operate as a single service, and you don’t know anything about the end customer experience: In addition to standard telemetry, StackState collects trace data and is able to create a complete picture by correlating trace data with telemetry and topology over time. By creating a monitor, you can finally measure end-to-end trace data and spot if customer experience is suffering.
Teams have a lot of autonomy, and as a result, it’s hard to know if compliance requirements are being met: With the move to cloud and container technologies, plus the adoption of modern DevOps practices, teams accelerate their delivery and come up with their own development tool stack. However, if you’re in a highly regulated environment, you still need to ensure certain rules are followed, including rules such as: allowed number of replica sets; making sure containers are pulled from the approved company container repository to ensure security; required audits of pipelines that push deployments to production and so forth. All these requirements can be observed with the help of 4T Monitors.
Example monitors
This rule validation capability, in combination with StackState’s topology and health state propagation, provides immense flexibility to express a multitude of different types of rules such as: desired structure for topology, performance diagnostics, security and compliance checks, and business-impacting KPI- and SLA-derived rules.
4T Monitors
Based on topology structure, check if a publicly accessible, business-critical service is configured in a highly available fashion (e.g., at least three Kubernetes pods at all times) and with redundancy (e.g., pods are replicated in multiple data centers).
Report a critical health state of a host if its CPU load is higher than 90%, as reported by traditional metrics from Prometheus.
Report a warning state if a Docker container uses an image that doesn’t come from a trusted source, based on topology metadata.
Using metrics and topology metadata, check if the availability metric of a critical service is met according to the agreed-upon SLO value defined in its topology metadata.
StackState’s new 4T Monitors leverage many types of observability data, including topology, to alert on a failure or potential issue.
Endless possibilities due to advanced query mechanism
As the examples above show, StackState’s new monitors go beyond performing regular checks on metrics streams. They are utilizing the full 4T Data Model to improve the overall monitoring process:
Simplified management and the ability to easily and quickly define custom monitoring, with the ability to validate that the monitoring logic is behaving correctly in advance.
Greatly simplified deployment of monitoring logic: monitor definitions can be applied quickly, start running immediately and cover the topology thoroughly, without having to modify each component one by one or change existing topology synchronization configurations.
4T Monitors can be placed outside of a StackPack and managed externally as code, via the well-defined textual representation and a CLI, providing for more ways to organize the custom monitoring configuration (e.g., GitOps).
Finally, 4T Monitors can leverage the full 4T Data Model and combine this data in novel ways, providing more varied approaches to monitoring than traditional telemetry-based validation rules.
StackState is the only observability platform that is able to do validation checks on topology structure and topology properties, lending much greater depth to your observability capabilities. With this ability to do complex checks using multiple types of data, 4T Monitors further enable one of StackState’s main value propositions: prevent problems proactively. They allow any enterprise to define controls for their entire development organization. Monitors provide a non-intrusive way to build a safety net in which all engineering teams can accelerate and focus on software development. Once the controls are built, there is no need for individual teams to create, apply or maintain all these monitors.
Conclusion: Topology as the anchor for smart observability
As companies improve the maturity of their observability practice, their data becomes more structured and they start to aggregate it in a central place. Topology provides the anchor to connect these millions of individual data points together and to show how everything is related. It provides an excellent foundation to articulate smart monitoring rules that can be combined with other types of monitoring and applied at scale.
4T Monitors are of great value to articulate a rule once and apply it across your entire IT environment, which is especially helpful when skilled resources are limited. They give you additional control that lets you flag and address potential issues, often preventing problems before they start. With 4T Monitors, you can improve stability and create a more reliable and enjoyable experience for your customers.
Learn more from the resources, below.


