
Operating Kubernetes reliably and efficiently involves adhering to a set of best practices. These practices help ensure the stability, scalability and maintainability of your Kubernetes clusters and their applications.
It's crucial for platform teams (responsible for the infrastructure) and software development teams (responsible for deploying applications) to work together in applying these practices.
Here are some general best practices for Kubernetes users to consider:
Cluster architecture: Opt for high availability, distribute nodes across zones and select appropriate node sizes.
Data protection: Regularly backup configurations and establish a disaster recovery plan.
Deployment pipeline: Establish a reliable pipeline and a strategy of continuous integration and continuous delivery/deployment (CI/CD).
Documentation and instruction: Maintain all reference materials and provide regular training for both platform engineers and software developers.
GitOps: Use version-controlled repositories for application lifecycle management.
Infrastructure as Code (IaC): Use well-tested tools for version-controlled infrastructure management.
Resource allocation: Define resource usage limits, implement namespaces and set quotas.
Resource scaling: Employ auto-scaling mechanisms for efficient resource allocation.
Security: Enforce least access privilege, enforce Network Policies, update regularly and implement role-based access control (RBAC).
Now that we’ve covered some of the best practices for working with Kubernetes, you should also know that with StackState, key best practices (and many others) are encoded within StackState out-of-the-box monitors.
What are StackState’s monitors?
StackState monitors metrics, events or logs and can also monitor topology and meta-data to detect common issues and ensure compliance and adherence to industry standards.
Our monitors come ready to use out-of-the-box and allow you to check signals automatically. This can be done on a broader set of items available in StackState on metrics such as:
golden signals, used to detect unusual behavior on a service endpoint
memory usage
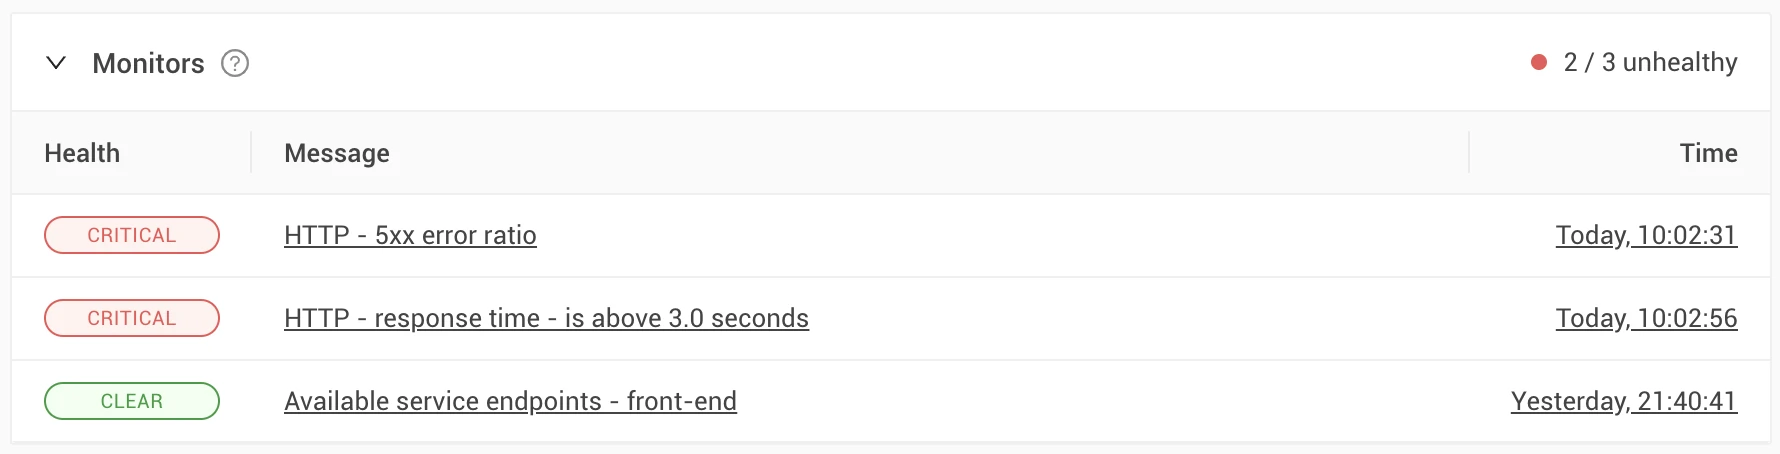
Based on the monitoring result, a component's health status is defined. Depending on the monitor configuration, the health status can be one of the following states:
Clear: Everything is okay; normal behavior.
Deviating: The resource exhibited suspicious behavior that is different from normal, but the resource still works in most cases.
Critical: The resource does not work at all.
Not only does StackState allow for monitoring particular metrics, but it also provides a way to monitor patterns in the configuration of resources. It gives the ability to warn on those and ensure the behavior, configuration and status are all covered.
Combining monitors with our unique troubleshooting intelligence, StackState quickly detects related issues and advises on how to remediate them.
This proactive approach reduces the risk of undetected problems and helps maintain a healthy and robust Kubernetes environment. Monitors are accompanied by remediation guides specific to the resources on which they are alerted and the monitored condition to guide you in troubleshooting.
Why out-of-the-box monitors matter
"Out-of-the-box" describes something ready to use or implement immediately without additional configuration or customization. In the case of StatckState, "out-of-the-box" refers to features, functionalities and solutions that are available and operational upon initial installation or setup without requiring additional modifications or adjustments.
Here's why out-of-the-box monitors matter:
Automated oversight: Out-of-the-box monitors constantly watch essential signals to ensure your application runs without a hitch.
Effort and expertise: Setting up monitors from scratch can be challenging and needs much expertise. But with StackState, standard issue monitors are ready to go, saving you time and effort.
Quick start: You can begin monitoring your application in no time with the monitors provided by StackState.
Customization: Skilled engineers can include custom monitors to expand coverage and address specific needs. This adds an extra layer of protection.
What out-of-the-box monitors does StackState provide?
Out-of-the-box monitors are delivered with the StackState product, but new monitors are regularly added, while others may be updated as needed.
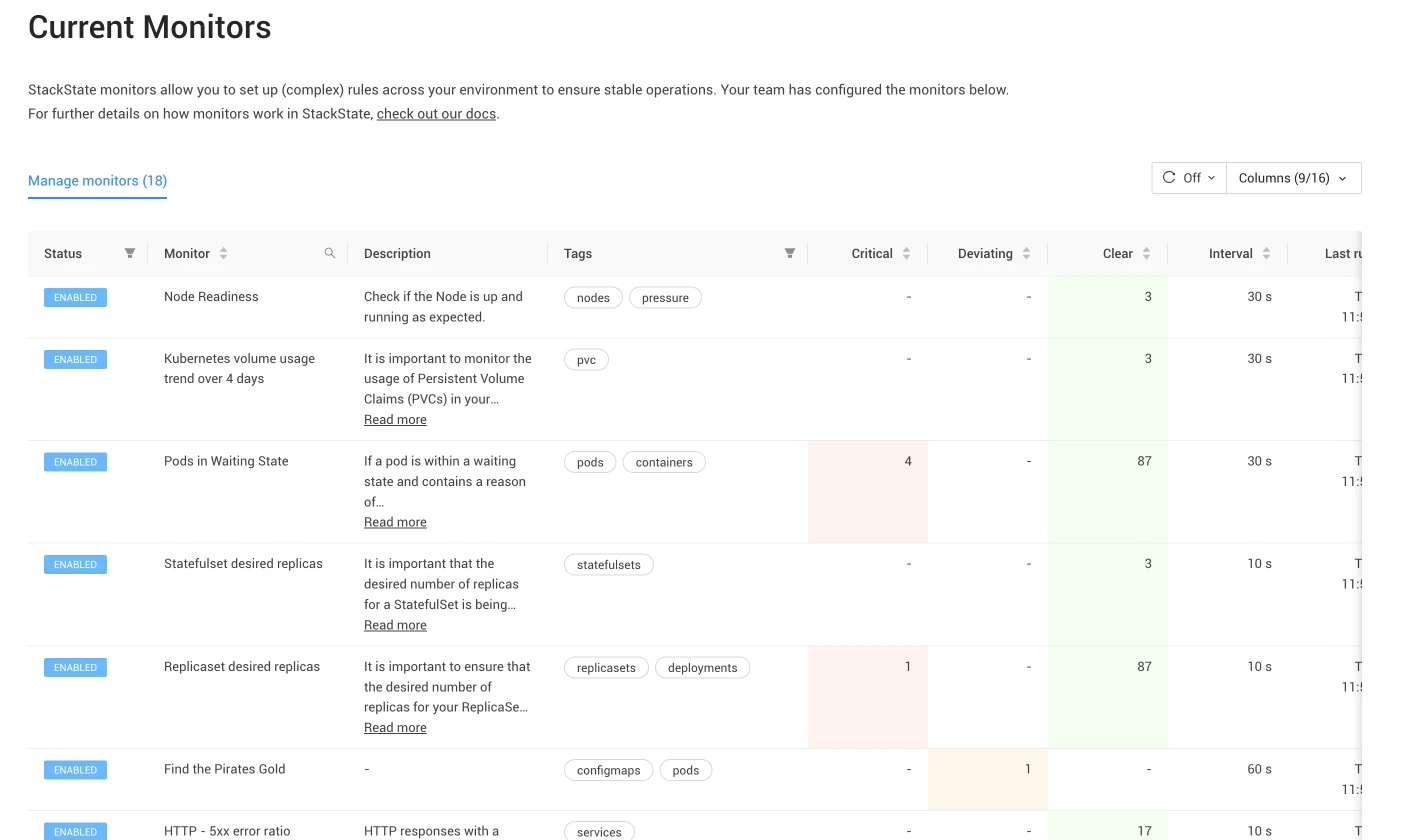
The following are some of our most handy out-of-the-box monitors:
Available service endpoints: Ensuring user access to your services is vital. StackState's monitoring confirms service availability by checking for at least one active endpoint. Endpoints facilitate communication between system parts, and if no endpoints exist in the last 10 minutes, the monitor signals a deviation, hinting at potential service problems.
HTTP - 5xx error ratio: Server-side errors, like misconfigurations and overloads, trigger HTTP responses in the 5xx range. For a smooth user experience, the 5xx responses should make up less than 5% of total HTTP responses in a Kubernetes service.
HTTP - Response time (Q95) above 3 seconds: Monitoring Kubernetes service response times is crucial. StackState tracks the Q95 response time, where 95% of responses are faster than expected. This is a valuable measure for identifying outliers and slow requests that may negatively impact the user experience. If Q95 surpasses three seconds within a set timeframe, the monitor flags it as deviating and sends a notification.
Kubernetes volume usage trend (12 hours): Monitoring Persistent Volume Claims (PVCs) is critical to ensuring data storage availability. StackState predicts PVC usage over 12 hours using linear forecasting. You'll get a notification to prevent data loss or downtime if a shortage is expected within this window.
Kubernetes volume usage trend (4 days): Watching PVCs over time is crucial for data storage. StackState's four-day forecast, using linear prediction, helps prevent data loss or downtime by alerting you if PVCs might run out of space.
Out-of-memory for containers: Containers running out of memory can crash, become unresponsive and risk data loss. This check identifies such containers, enabling timely action to avert problems.
Pod readiness: This monitor check ensures pods are scheduled, running and ready for traffic within the expected time.
Pods in waiting state: Pods in a waiting state due to reasons like CreateContainerConfigError, CreateContainerError, CrashLoopBackOff or ImagePullBackOff are flagged as deviating.
It should be noted that you can check our documentation to learn about other monitors delivered with StackState.
Using Out-of-the-Box Monitors for Troubleshooting
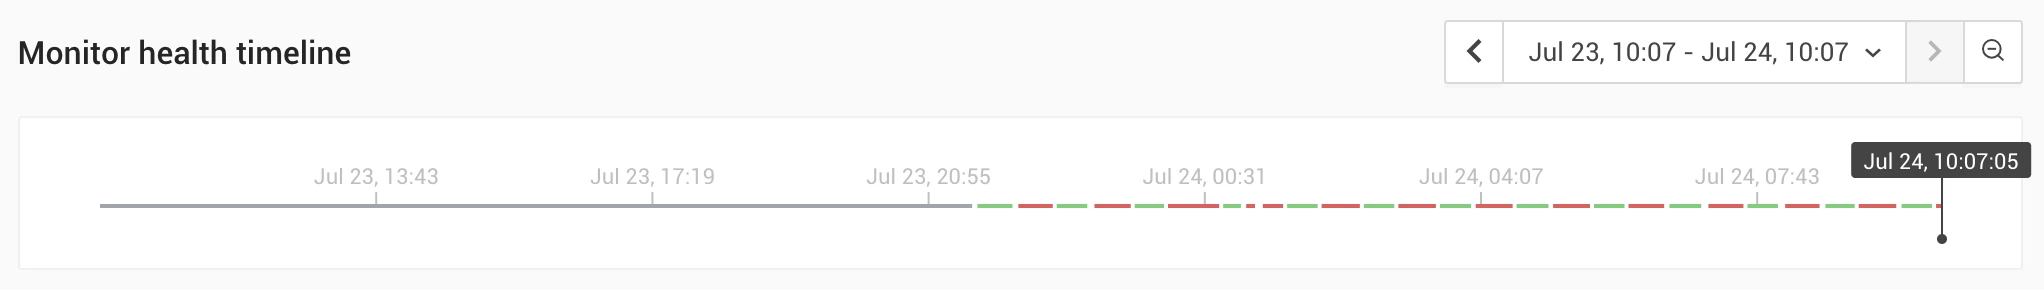
The monitor's output is displayed on StackState's resource highlight pages, providing an instant overview. If a monitor indicates deviation or a critical state, click to access detailed explanations, health timelines, supporting metrics, if applicable, and the reason behind its activation.
This output reveals the current monitor's status and leverages knowledge about related resources. These connections, whether through configuration, runtime, or service dependencies, help you understand the broader context and how it connects to other system issues.
Below you'll see an example issue description and the supporting metric. Users can also set alerts to be notified about monitor status changes.
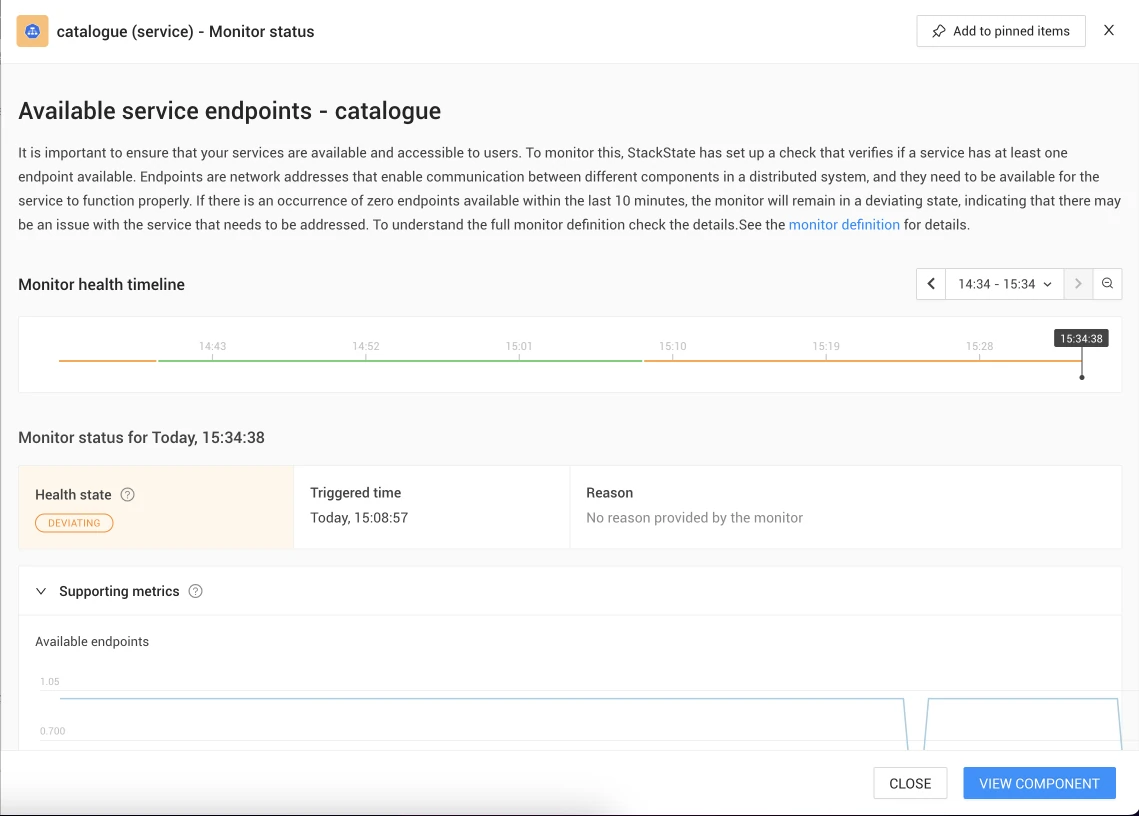
And most important, StackState provides a step-by-step remediation guide explaining how to troubleshoot an issue. Learn more about StackState remediation guides .
Who benefits from out-of-the-box monitors?
Software Teams: Software teams can really make the most of these out-of-the-box monitors. They're like a shortcut to understanding what's happening in an app without causing developers to lose focus on their coding work. The helpful guides that come with the monitors act like a troubleshooting assistant, so developers can fix issues independently while saving time and avoiding recurring mistakes.
Platform Engineering Teams: These out-of-the-box monitors are like a toolbox full of solutions for platform engineers. They can use the pre-made monitors as-is or tweak them to fit their needs. This approach to sharing troubleshooting know-how helps platform engineers cut down on repetitive work and frees them up to concentrate on enhancing the platform.
SRE Teams: SRE teams are crucial in steering engineering groups toward better observability practices. They can also add their expertise to expand monitors and guides, making troubleshooting even easier. By setting up monitors and guides just once, the entire team can enjoy the perks — these solutions automatically kick in for all upcoming pods.
What else should you know about StackState monitors?
Part of Our SaaS Service: StackState's out-of-the-box monitors are a core component of our SaaS offering, and they're available with every pricing plan. These monitors come pre-configured and are activated as soon as your environment shows signs of trouble.
Intelligent Signal Detection: Monitors watch for signals hitting specific thresholds. When these thresholds are met, they automatically trigger the right remediation guide. This means you get instant guidance with the exact steps needed to fix the issue.
See how it works here:
Are you ready to experience the power of out-of-the-box monitoring? Try it yourself!
With StackState's Kubernetes monitors, you'll enjoy faster, more efficient troubleshooting and spend less time navigating through multiple tools to discover the issue that’s working against you. Best of all, you'll know exactly how to remediate the problem.
Try out-of-the-box Kubernetes monitors in our playground, featuring a Sock Shop demo application for you to explore and discover the benefits of streamlined Kubernetes troubleshooting. Click here to jump right in or to watch the introduction .
And have a look under the Monitors section in the main menu to find the complete list of the monitors that StackState delivers out-of-the-box.


