
StackState has always believed in the importance of open source and open standards, and we’ve demonstrated our commitment through ongoing support of open technologies. From the beginning, StackState supported StatsD and OpenMetrics. Even our agent is open source, designed to help organizations easily onboard our platform and to give them an extensible open way to observe their services.
StackState is now proud to announce our next big open source step. With the 4.6 release of StackState, we have added our first support for OpenTelemetry traces.
OpenTelemetry - the new open source standard
OpenTelemetry is the new open source standard that teams can use to build observability into their applications. It is a collection of tools, APIs and SDKs that can be used to instrument, generate, collect and export telemetry data (metrics, logs and traces) to help analyze software performance and behavior.
OpenTelemetry allows teams to observe applications without detailed custom integrations and without installing proprietary agents. It has multiple business benefits for teams:
It supports the trend to shift left, to move observability into the hands of developers and build it into applications: It’s a developer toolkit and is actual code (rather than a closed source agent they do not control). Teams no longer need to use agents to collect information; instead they can use “as code” practices to build observability into their applications.
It standardizes observability instrumentation via provided libraries and agents, and it allows for extending them. Using standards makes it much easier to connect applications, data and tools.
It reduces latency in receiving telemetry data so results are more accurate and consistent; teams can easily send the data to any observability system supporting OpenTelemetry without custom integrations.
It looks beyond the technical metrics and allows teams to augment the collected data with more information about the business process than traditional APM tools can provide. This business focus provides deeper insights into how applications and services are being experienced by customers.
Observing serverless applications is challenging
As technologies become more complex and more dynamic, their stacks become harder to observe. Serverless applications present particular challenges because their infrastructure is completely dynamic, they are even more granular and complex than their ever-shifting, container-based cousins and they have many dynamic dependencies. Serverless components come and go quickly, so troubleshooting them can be like finding a needle in a haystack. This complexity makes them nearly impossible for even experienced team members to keep track of in their heads. The challenges compound when you try to train new team members.
Teams need a way to build an understanding of serverless environments so they can build serverless applications faster, as well as effectively troubleshoot them. They need a deep, structured, context-aware representation of the entire environment as it changes over time, one that provides insights at the business level and at the component level. OpenTelemetry, combined with topology data collected over time, is a core enabling technology for creating reliable serverless applications.
Unified serverless observability with StackState v4.6
With StackState v4.6, we are adding support for OpenTelemetry traces, specifically for serverless AWS Lambda applications built with Node.js. Using this new low-latency data requires no integration and it immediately enriches your topology with additional relationships and telemetry.
With StackState’s topology-powered observability, you can see the state of your stack—which components exist and how they are performing—at any point in time. StackState provides the foundation you need to track changes as they happen across your environment, enabling you to effectively observe serverless applications.
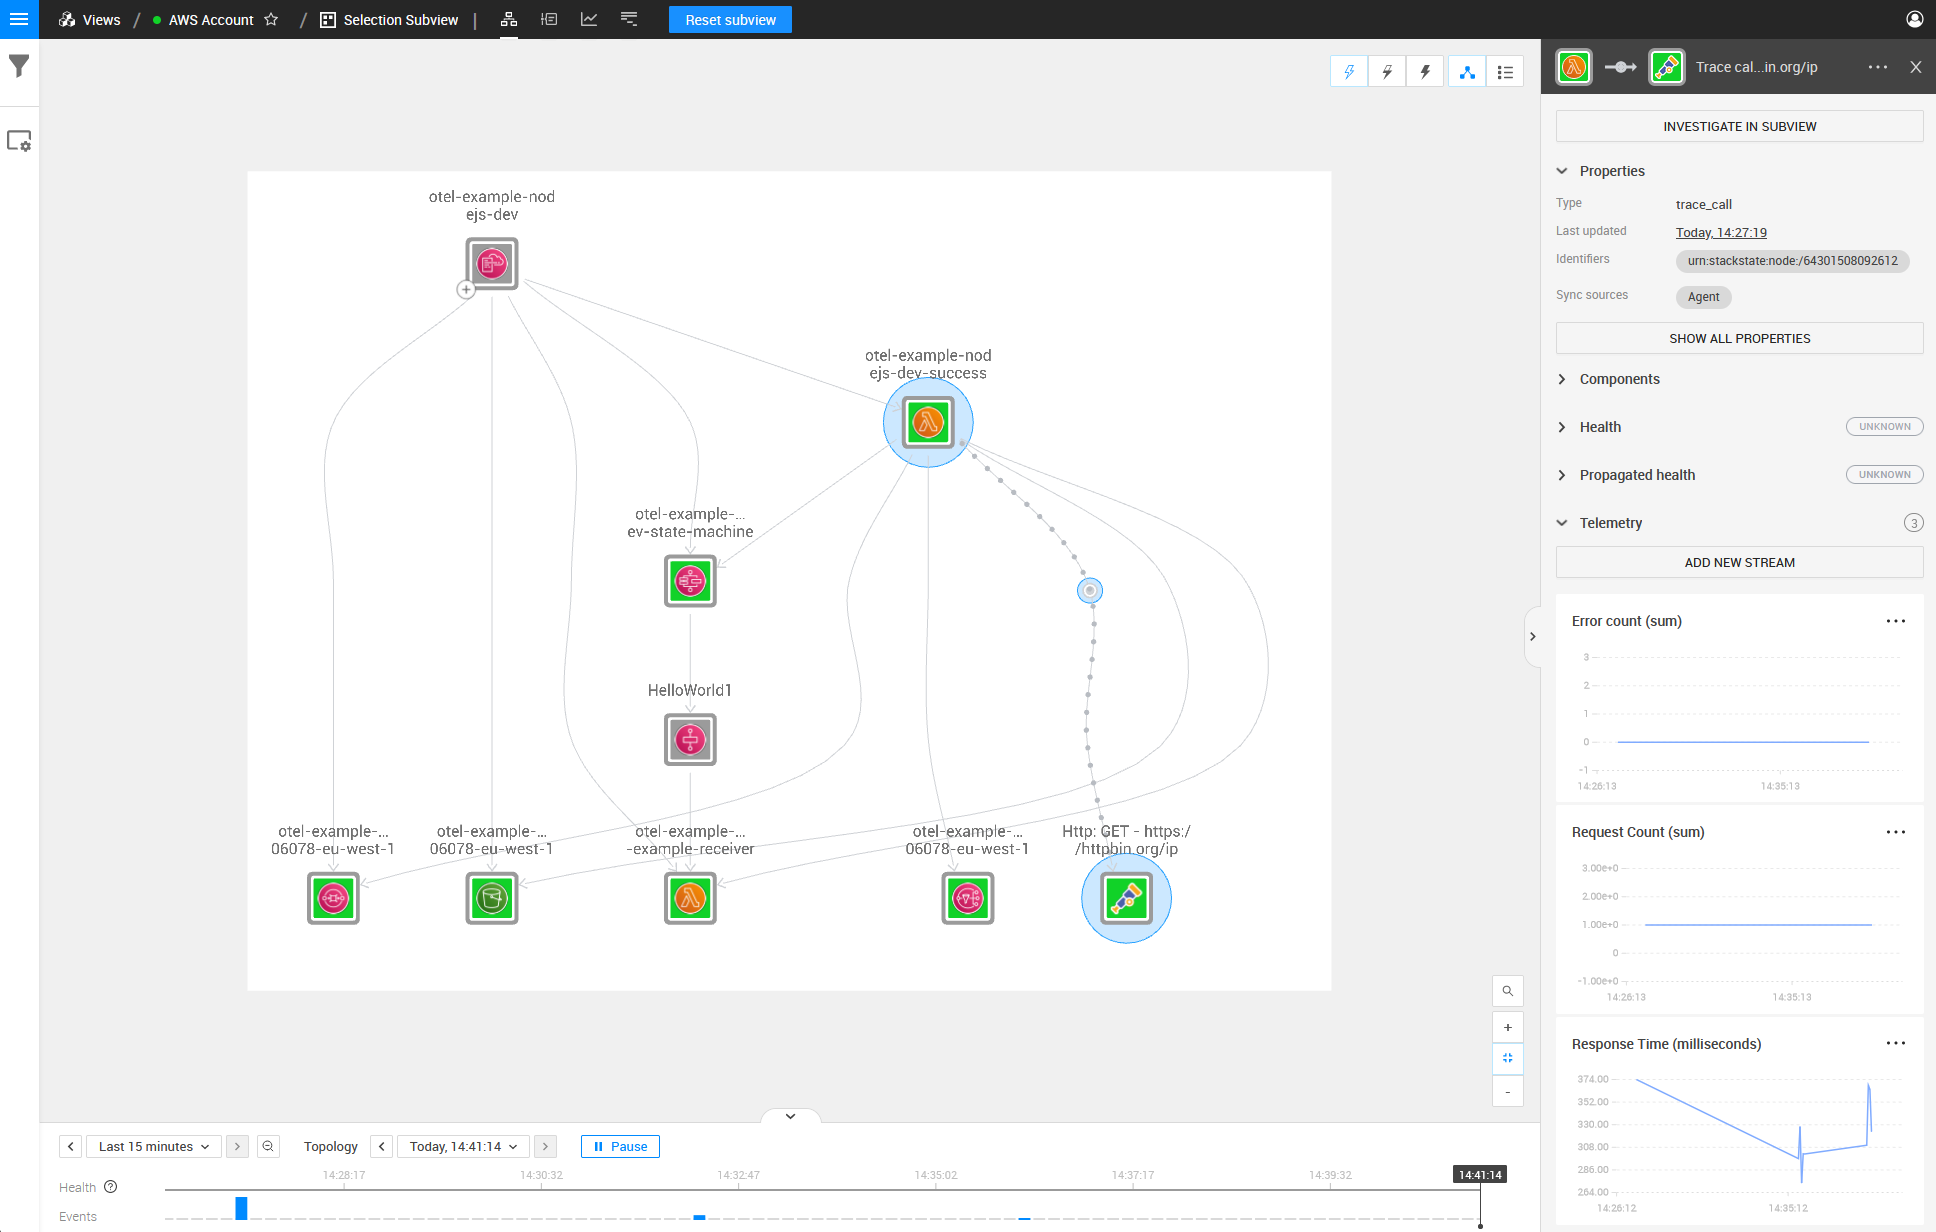
Traces show the path of a customer’s transaction through the various services it traverses in the stack and give insight into usage, errors, throughput and dependencies. Our new OpenTelemetry support instantly brings this serverless trace data into our 4T data model and into our topology visualization.
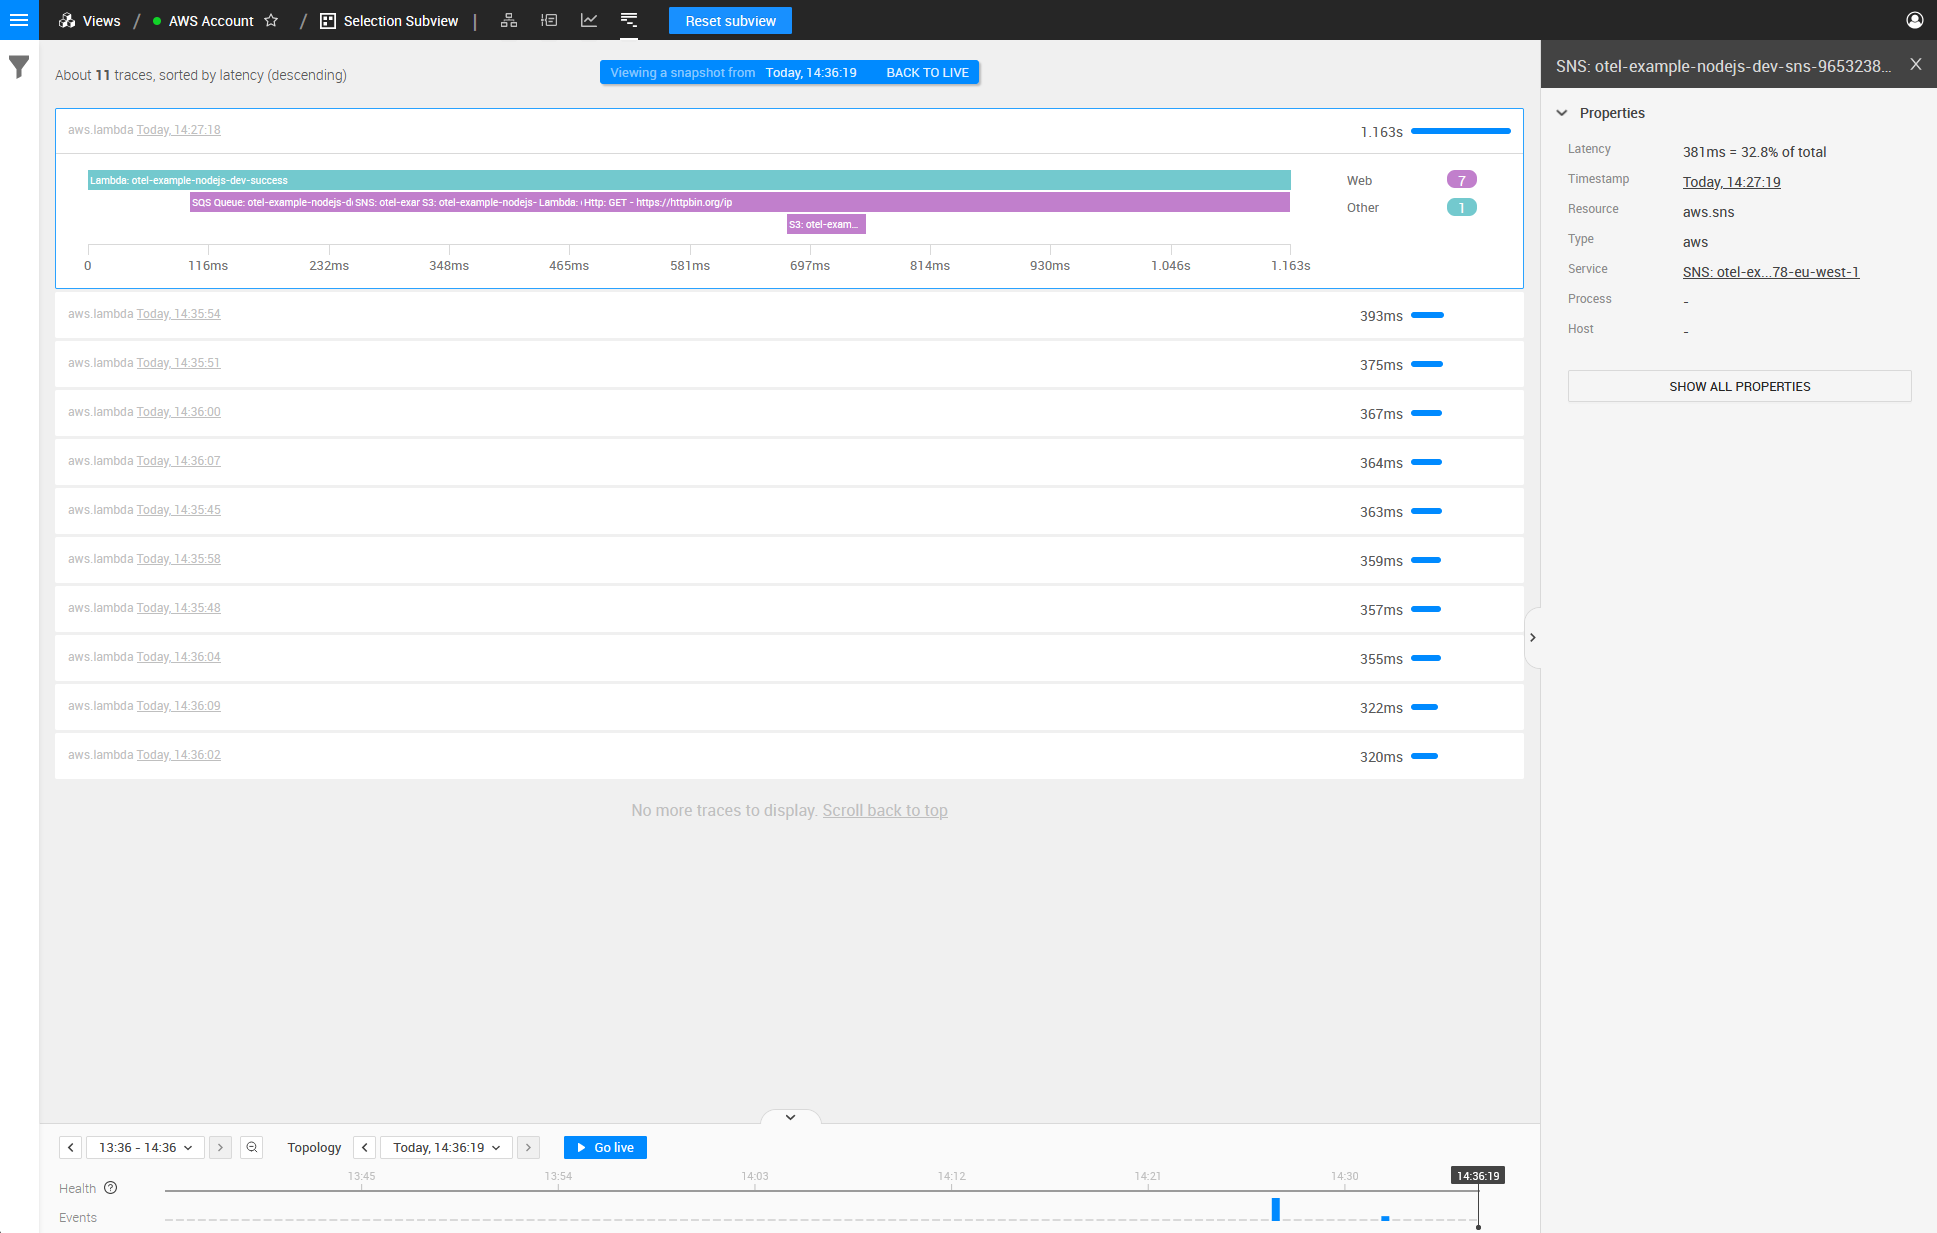
By combining OpenTelemetry trace data with all of the other rich observability data we capture, StackState helps you accurately determine root cause of incidents, reduce alert noise, see the impact of changes on important business services and proactively detect anomalies so you can address them before they become incidents.
Want to learn more about StackState?
Take a look at our Playground
Learn how our 4T Data Model enables topology-powered observability
Read more about how StackState v4.6 helps you harness the power of Topology + Telemetry + Traces + Time for better observability


