
Ever since those early days, I’ve witnessed Murphy's law in action on a daily basis. I've seen all kinds of IT problems—from sudden hardware failures to problems relating to time zones, unicode, time and space complexity, memory leaks, distributed systems—you name it. And in the last few years that I’ve been working at StackState, I've heard a lot of the IT war stories that happen at big companies.
Because of all of this, I feel quite confident to make the following claim: IT problems all around the world generally follow the same pattern. Whether the problems result in a major outage, partial availability, or performance degradation, the escalation of the problem follows a highly predictable trajectory—all the way from its root cause to its business impact. And time-traveling topology is essential for investigating and resolving these problem patterns. Just like I did when I was a kid, going back in time to figure out why my self-created game didn’t do what I wanted it to do – and then fix it.
It’s all about topology
As an industry, we've been unable to adequately capture such patterns, until now. In general, organizations lack an understanding of their environment’s real-time topology. Topology is one of the four cornerstones, or dimensions, of StackState’s 4T data model—along with telemetry, traces, and time.
In computer systems, we distinguish between different types of topology—infrastructure, application, and business topology. Infrastructure topology is everything from blades in racks in data centers to software-defined networks and Kubernetes clusters. Application topology is any type of software running on top of this infrastructure to support the business. Business topology defines purely the business services and processes and how they are related.
What crime scene investigations have to do with IT problems
When a problem does appear in the overall topology, solving it requires grasping the chain of events, or issues, that led to it. Perhaps a gruesome analogy, but if you have watched a lot of crime series, like me, you can compare the investigation process to a forensic scientist who walks into a bloody crime scene and attempts to understand the chain of events of a crime through the random (or not so random) blood splatterings. The chain of events leading up to that horrific event is what needs to be uncovered and understood so that the criminal—the source—can be identified.
So, when investigating the causes of companies’ IT problems, StackState’s time-traveling topology is like having multiple video cameras on 24/7, recording everything. Like the forensic scientist and investigators who look for clues from the past to solve a crime, the engineer also has to travel back in time to find the source of a problem. Arguably, the engineer can more easily time travel through data than the forensic scientist, using StackState’s 4T data model.
When a problem escalates
A problem can start with a seemingly simple change, like a reboot or software deployment. That simple change hits somewhere deep inside an IT stack, setting off a chain of events. First, it causes a cluster of anomalies, then a cluster of alerts. Anomalies can be caused by internal or external changes inside or outside of an organization’s scope of control, such as a DDOS attack or a change in user behavior after some promotion. Alerts are like anomalies, typically happening in clusters. They are often reported by multiple monitoring solutions and examples include various system errors, latency spikes, and more.
Quite often, alerts automatically translate to incident tickets one-to-one, although usually some rules are set up to only create incidents based on some alerts. Incidents are also often created manually based on user reports/complaints instead of alerts. In this case, it can be hard to relate incidents to the signals coming from the monitoring solutions. Because of the constant barrage of alarm bells going off, it can be difficult to discern what corresponds to the incident.
These chains of events start with one or more root causes and follow a very specific pattern through the IT environment over time, causing all kinds of havoc. If you follow the events on the timeline, starting from the causing events, through the topology over time, you get what I call the “escalation graph.”
The escalation graph
The escalation graph is what connects root cause to business impact and extends all the way to the fix of the problem.
An escalation graph is a temporal graph, which consists of nodes and relations. The nodes of the escalation graph represent IT components at specific times. The graph has two types of relations: temporal relations and dependency relations.
Temporal relations describe timelines for each component. Temporal relations always only connect components with their past self each time a significant event occurs (in terms of the problem).
The dependency relations describe how components, broadly speaking, affect each other.
The escalation graph covers those components and those events that were related to the problem, from cause to fix. Escalation graphs of several problems may overlap, merge and fork.
Let's look at an example escalation graph for a typical problem often seen in modern IT environments. The topology (0) shows that a set of important customer-facing services depends on a set of microservices, that in turn depend on a database.
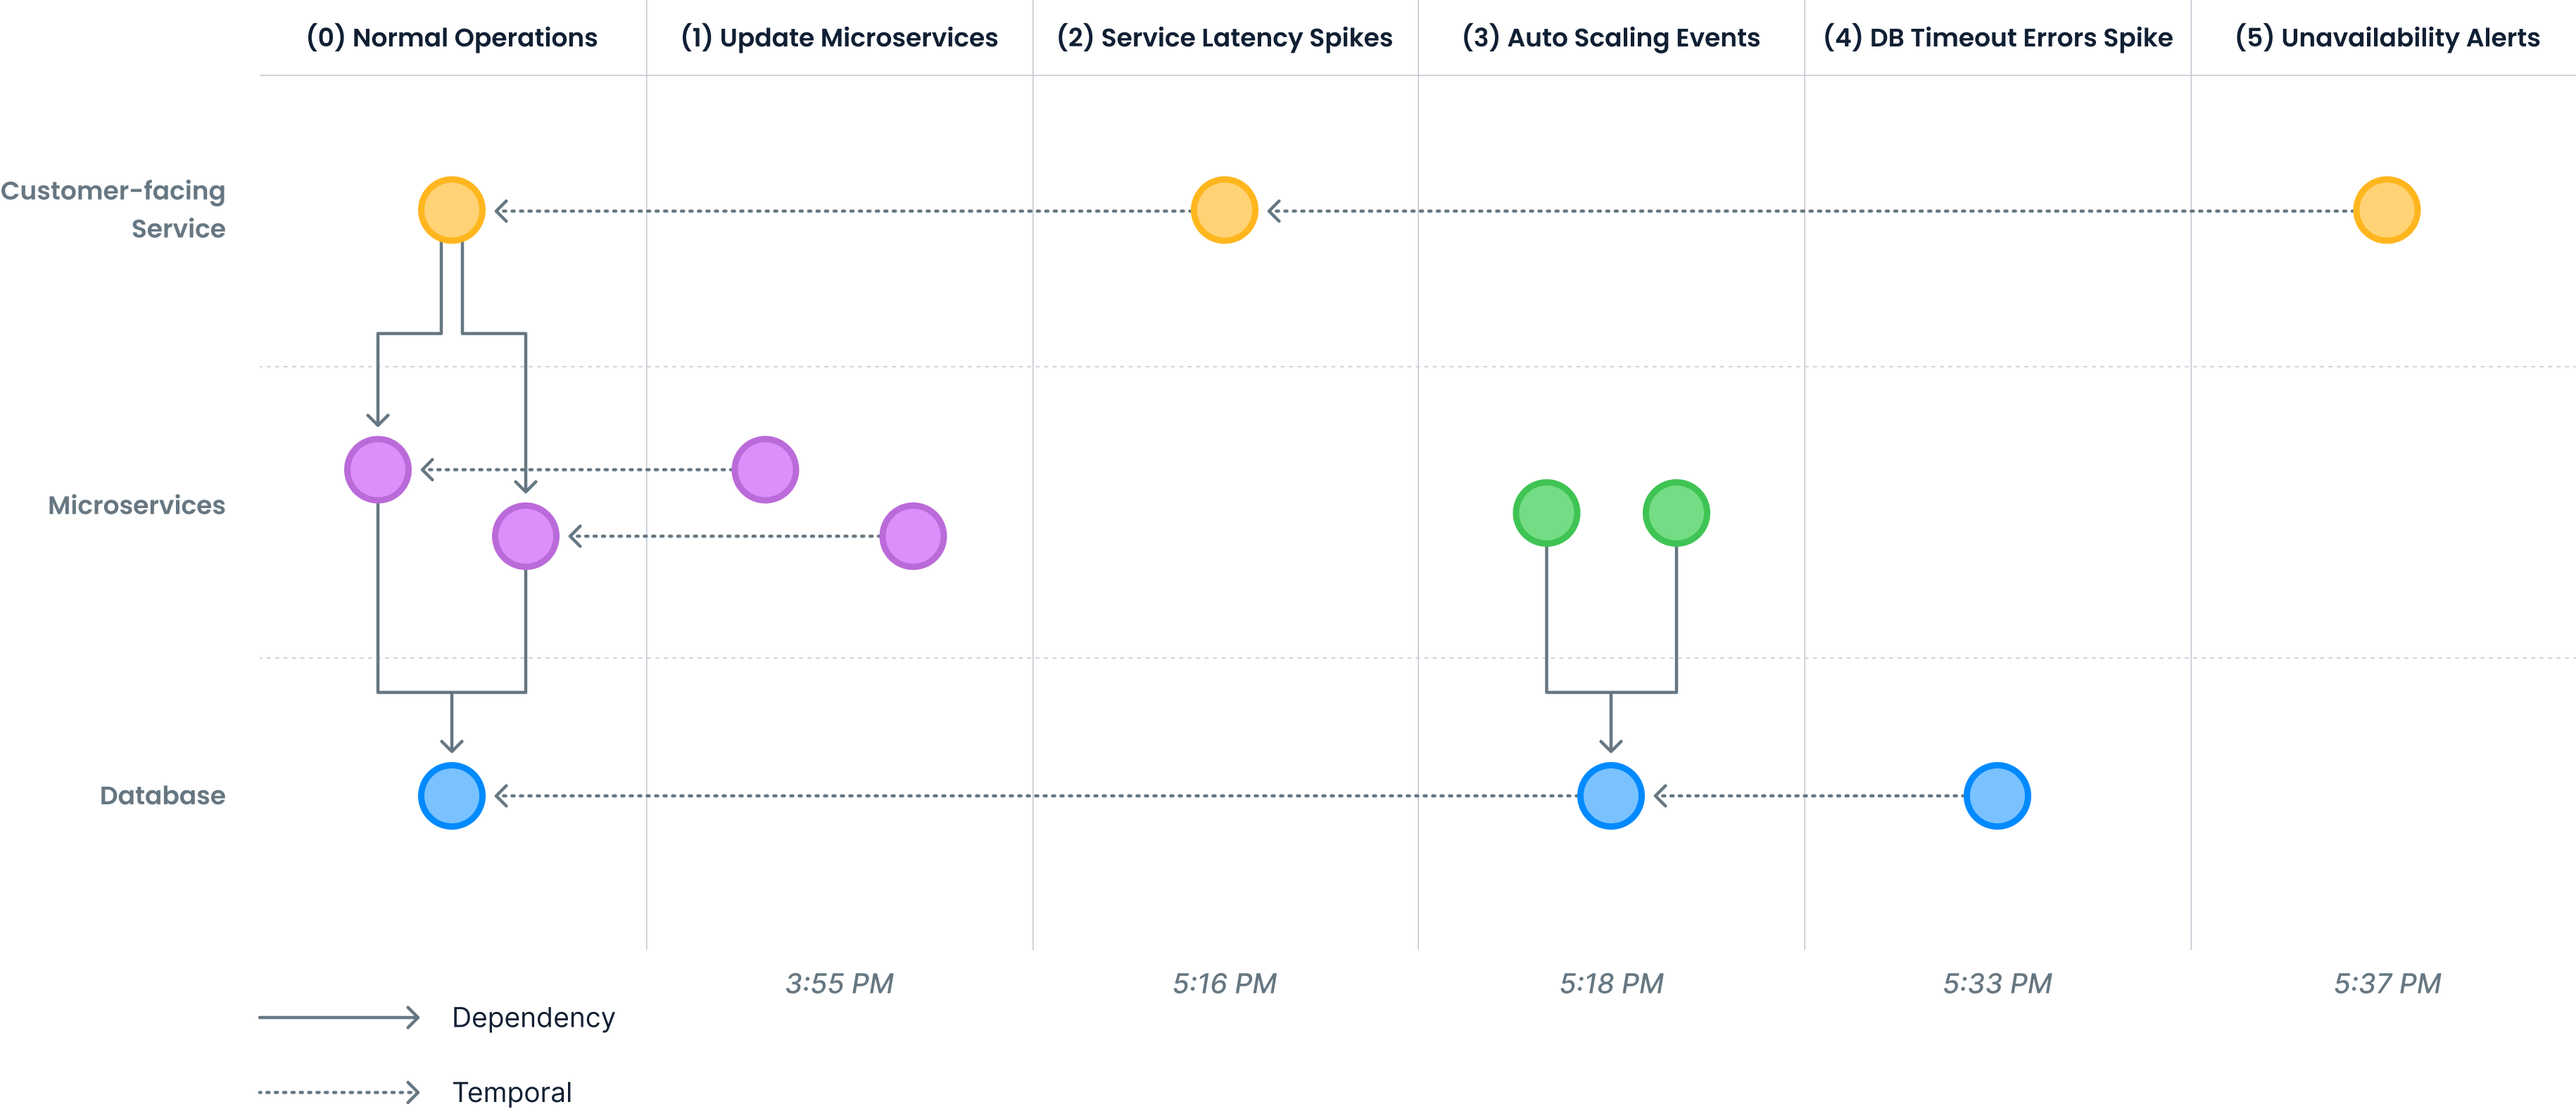
The escalation graph shows a scenario that leads to down-time which start at 3:55 PM:
(1) The problem starts with an update to some microservices.
(2) Latency spikes are the result of the slightly degraded performance characteristics these microservices have.
(3) Because of the increases in latency the auto-scaler decides to add more microservice instances that immediately connect to the database.
(4) Unfortunately, the database is not that elastic as the microservices, causing severe resource contention, are followed by spikes in timeout errors.
(5) The result is general unavailability for a large number of users.
This is where time travel comes into play
Constructing an escalation graph requires a time-traveling topology. The reason is that the topology of an IT environment keeps on changing while the problem is happening. A change is often the cause of a problem. What’s more, in today’s cloud-native environments, changes are also automatically triggered after problems are detected. Changes, anomalies, alerts, and incidents from different systems must be calculated and/or plotted onto this time-traveling topology in order to construct the escalation graph. StackState's 4T data model captures all of this, and we can automatically reconstruct escalation graphs.
Why do you need an escalation graph? Because once you have one, you can:
speed up the root cause analysis process
communicate to the different stakeholders, who are seeing all kinds of effects but may not understand what is happening
prevent problems by targeting predictions for alerts based on the extrapolated problem evolution trajectory (preventing problems that happen deep in the stack, which - if left unchecked - will impact customer service (for example the check-out process, or the ability to stream video content))
and automate the remediation based on the root cause.
StackState’s unique 4T data model captures an organization's entire IT environment. You have the topology and, at each point in time, you have telemetry and traces running through it. As I mentioned, when you have a little change somewhere deep inside your IT landscape, it can point to future failures. What StackState is able to do, is to capture that entire sequence of events in an escalation graph. And then, once it has happened, StackState can use that information to get back to the root cause.
Automated problem solving
Moving forward, we want to start to automatically remediate the problem, where we may suggest a fix. We don't need to wait for anomalies to turn into alerts. We see a bunch of anomalies, so we can predict whether we will see alerts. And, if we have predicted the alerts on important business KPIs in the context of suspicious anomalies, we might proactively create the incident. That way, you won't even need to have downtime or performance degradation—we've recognized so many of these “escalations” and know that they follow this pattern.
So when we see anomalies appearing around the change, we know exactly how to calculate the alerts that might come from that, and then we can actually create an incident, maybe even suggest a fix to the engineer. And then it can be fixed even before it becomes a problem. Then, the engineer can just go on holiday. We see the change, we then see a bunch of anomalies. We predict that there's going to be a bunch of alerts and can then calculate the impact and determine what the fix should be and then fix it—while the engineer is just drinking his piña coladas.
That’s why StackState’s time-traveling topology and model are so unique. Predicting these problems is also why we built the autonomous anomaly detector I wrote about in my last blog. You need the context to keep from drowning in the predictive alerts that tell you nothing about the root cause.
Did I also mention how fun all of this is for people like me and my StackState colleagues? While getting lost in explaining the escalation graph, and why it’s so important, I’ve failed to mention just how exciting it is. Almost as fun as coding games as a kid. I guess we do it for similar reasons a forensic scientist is motivated to solve a crime. In the IT world, we finally have the opportunity to capture and understand IT problems in general, using time travel as a tool. It’s a beautiful and powerful thing.


