Recently I heard one of our prospects talk about a competitor who was promoting their data lake and then ask, how is StackState different than that? His question got me thinking about why a data lake alone does not provide the depth of observability you really need.
The goal of observability is to help SREs, IT Ops and DevOps teams run their IT systems with close to zero downtime. Consolidating data from across your environment into a data lake is certainly a good step. You need to bring everything together in one place to get a complete picture of what’s happening. Being able to unify and normalize data from your networks, databases, clouds, containers, other domains – as well as other monitoring and observability tools – is certainly very important.
But if all you have is a data lake, you will literally drown in data instead of maintaining reliable and resilient IT systems. A data lake, such as those provided by Splunk or Elastic, is missing two essential components: relationships (a.k.a. dependencies, represented in a topology) and time. These two components augment metric, log and trace data to create a data fabric that provides depth to your observability efforts. This additional relationship-based structure – indexed over time – will keep your observability efforts not only afloat but will ensure smooth sailing for your environment.
Relationships
It’s no secret that most incidents are caused by changes somewhere in the environment… but where? Your stack likely includes thousands or even hundreds of thousands of components that depend on each other (dependencies). If something goes wrong, you may get hundreds or even thousands of alerts going off as each of these components is affected individually.
In order to understand the root cause of a problem, you need to understand how all the contributing components are related. Which other parts of your stack does a particular component or service depend on? For example, if a database becomes overloaded or unavailable, what other business services will be unable to execute?
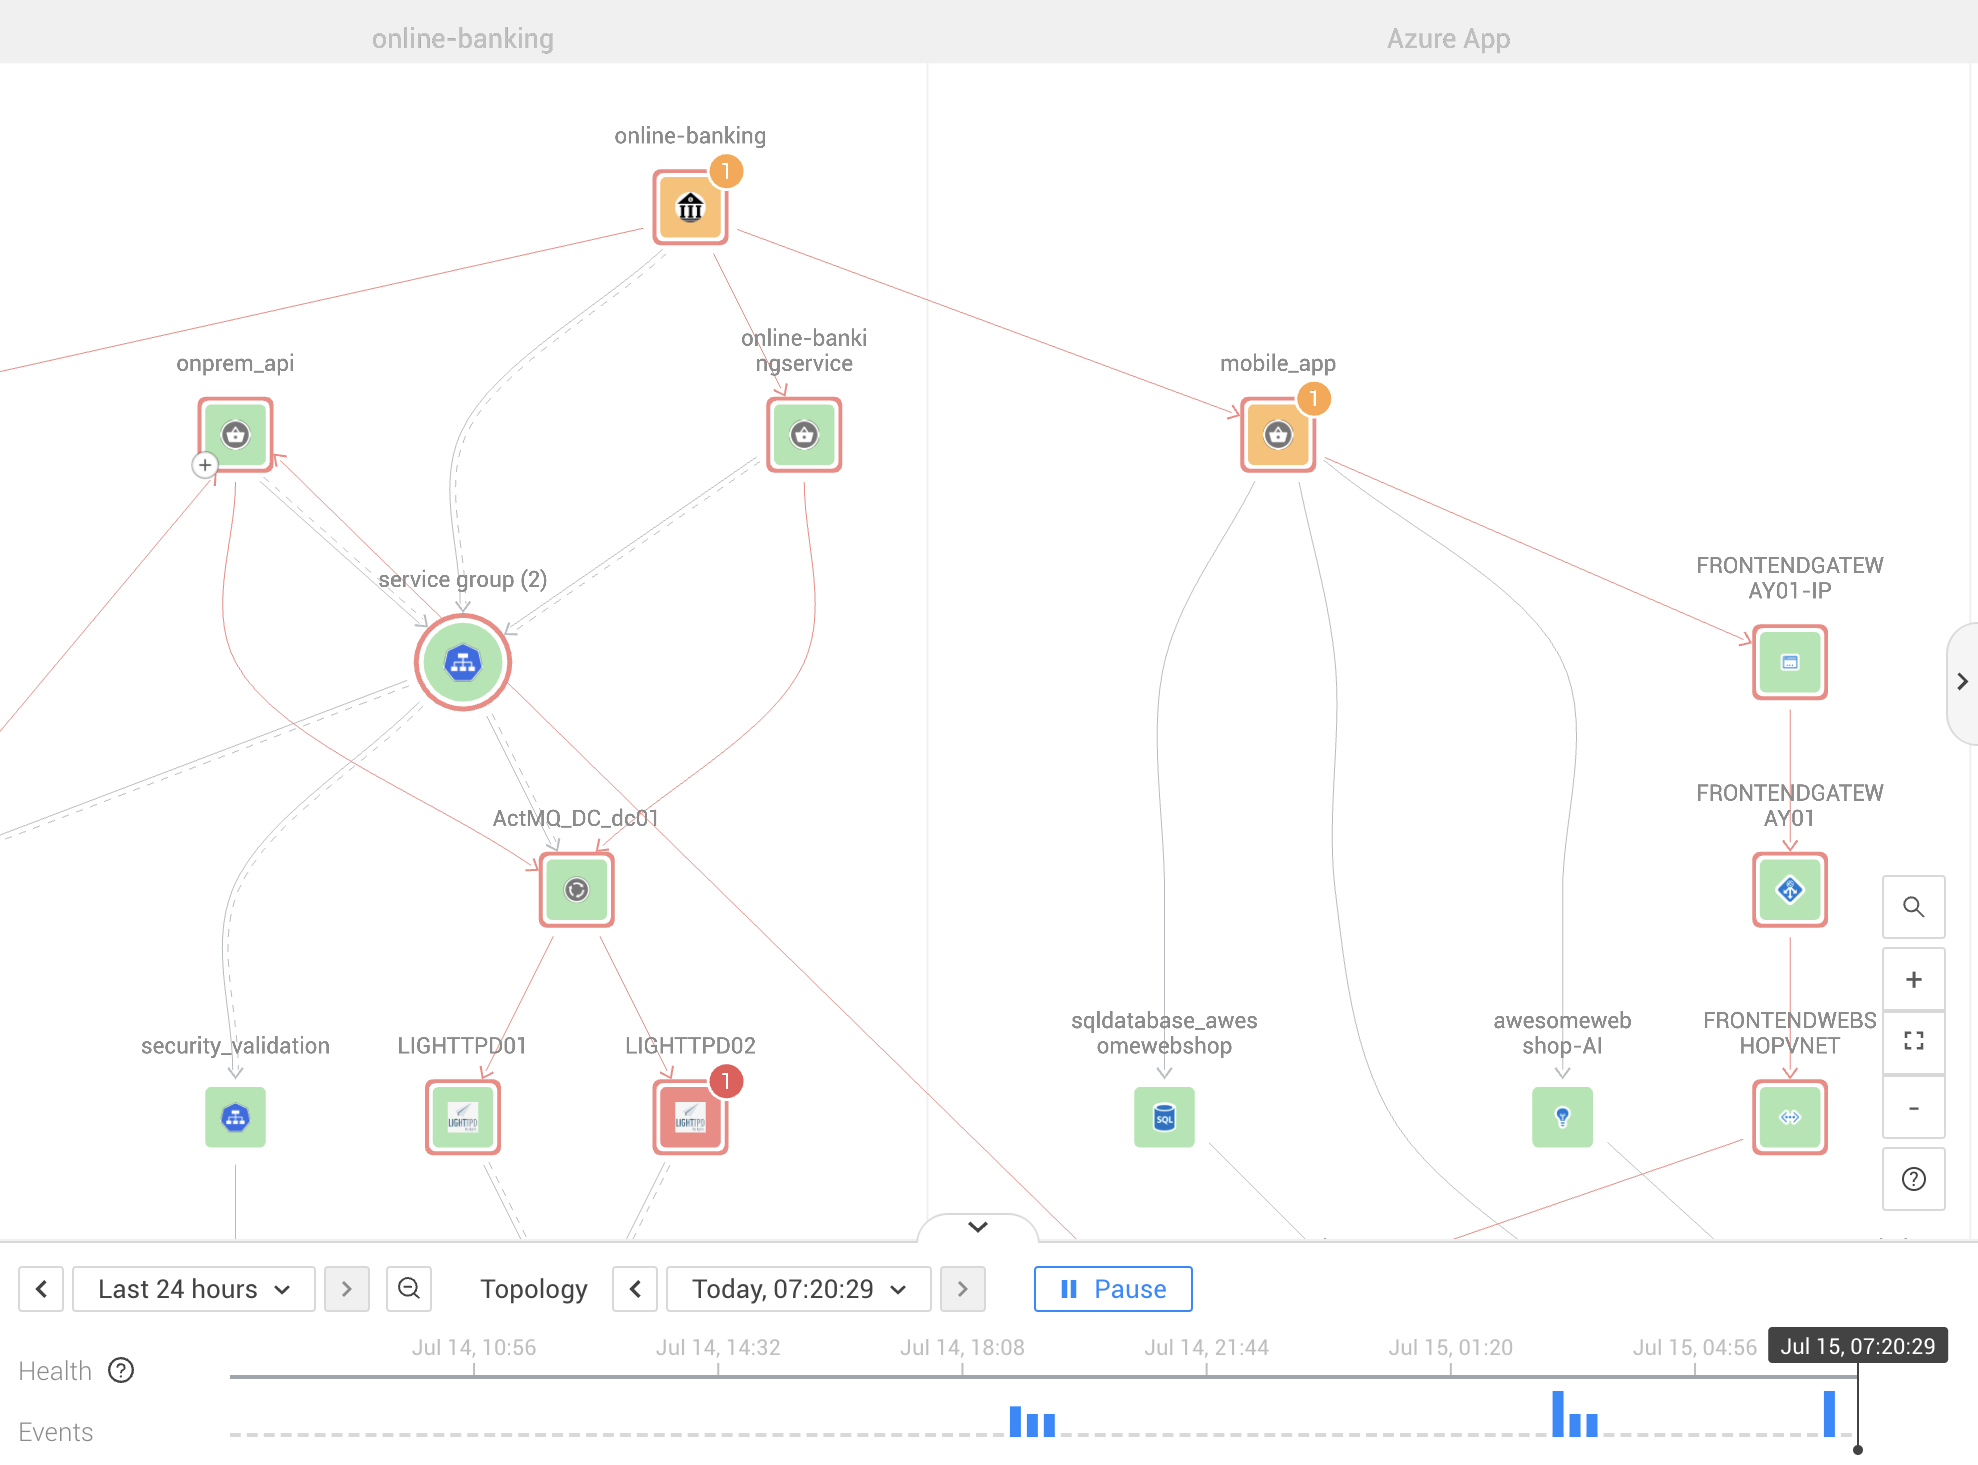
Your observability solution needs to create a topology that maps all of the components in your environment, clearly showing how everything is related and which components depend on which. A topology should also show the health of each component. If something fails, the topology map will show you what related components are also failing or likely to fail, so you can quickly zoom in on the trouble spot.
A data lake won’t show you the dependencies between all of your components. When incidents occur, you are likely to suffer from confusing alert storms and to spend a lot of time manually searching for the root cause.
As an added problem, data lakes are huge and already tax the abilities of the average database. Most databases aren’t designed to store relationships between objects, an essential capability for creating a topology. So you can’t just easily add topology to a data lake.
Especially when you really need a way to store relationships that change rapidly over time…
Time
Let’s say you just got several dozen alerts that something went wrong. But at this point, your stack probably looks very different than it did three hours ago, when your problem likely started.
In order to quickly trace a series of alerts back to the original cause, you need to keep track of how your stack changes over time. What cloud services were running? Which containers were active and which had spun down? What version of a service was deployed at that time? How was everything configured, and when did a configuration change?
A data lake won’t give you the context you need to see how your stack changed over time.
To really understand what change caused a problem and what effects propagated across your stack, you need to be able to see how your stack changed over time. What did it look like at every moment? How are all of the alerts related? Where did the problem begin? We call this level of insight – which lets you track the initial cause of an issue and its effects as they travel across your stack – causal observability.
Tracking an entire “graph” of your stack second-by-second – a graph that encompasses topology, trace and telemetry data correlated over time – is a difficult technical challenge. To store all of the information needed for causal observability, you need a special database – called a versioned graph database – that is able to capture relationships between a large number of objects and to store them at every moment in time. These databases take years to build, especially when you need them to scale.
A good start
We applaud the data lake vendors – they’re on the right track by bringing together disparate data. But they have a mountain to climb before they can truly use that data to provide causal observability and to relate data in a way that can power truly effective AIOps.
Bring it all together with StackState’s 4T Data Model
StackState is the only observability company whose platform is powered by a versioned graph database. Our solid data foundation enables us to capture the topology of your environment at every moment in time, so you can easily visualize how a change three hours ago propagated across your stack and caused the critical incident you see right now. If you already have a data lake, great! StackState consolidates data from all of the sources in your environment, including the data lake. The more data, the better. In addition to working with data lakes, you can also apply the power of StackState to amplify the effectiveness of your other observability and monitoring tools. (Read about how we work with Elastic here. )
StackState’s versioned graph database provides the foundation for our powerful 4T® Data Model, which combines topology with telemetry and traces from across your environment at every point in time. Analyzing all of this data together, StackState automatically suggests probable root causes of incidents and shows you exactly where they appear in your stack, as well as what other components are affected.
StackState also clusters alerts, so you know which ones are related to the same core issue. No more alert storms, no more time wasted looking in the wrong areas. Just clarity and fast problem resolution.
Finally, once again using the power of the 4T Data Model and versioned graph database, StackState applies autonomous anomaly detection to constantly monitor your environment for deviating patterns that may indicate trouble is coming. Using StackState’s AIOps and advanced analytics, you can proactively prevent those anomalies from becoming problems at all.
So don’t drown in your observability data lake – use StackState’s data fabric to create a solid foundation for smooth sailing.
Want to learn more about the levels of observability maturity and about StackState?
Watch the webinar, “Getting Started with Observability on Kubernetes”
Watch the webinar, “The Observability Maturity Model”
Download the Gartner® report, “Innovation Insight for Observability”
Reach out for a personal demo


