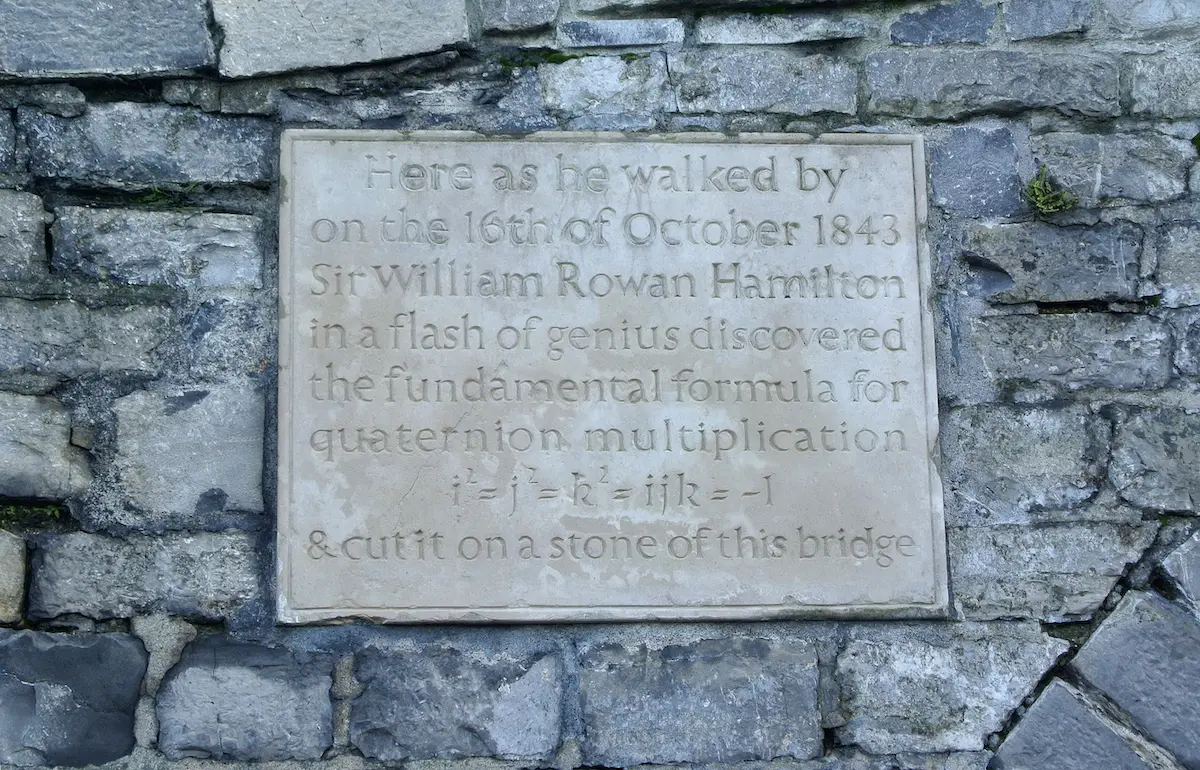
At times, the ability to get an insight into such complexity seems to me to require a superhuman amount of genius. Yet I recognize that Hamilton, that day on the bridge, had simply arrived at a critical point after a long and arduous journey. The end of one stage of the journey and the beginning of another. Once given enough background information on what Hamilton was exploring mentally, the equation that marks the completion of that stage of the journey, though still highly impressive, is not beyond human capability.
Sometimes the end of a journey is not marked by a flash of genius. Rather sometimes an idea can be the start of a journey and the realization of how strong a concept really slowly builds over time. So it is with what we, at StackState, call the 4T Data Model, which stands for: Telemetry, Topology, Traces and Time.
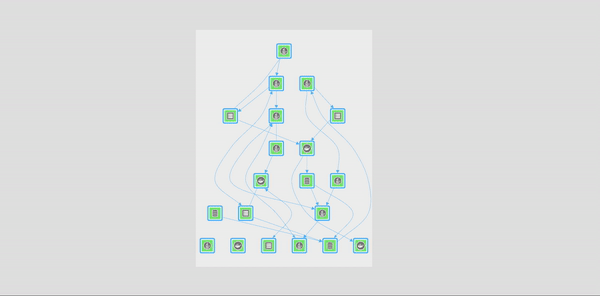
Like Hamiltons’ three letters i, j and k; the four T's are dimensions too, each one perpendicular to the other. The four T's are a way to model the configuration of what is going on in any IT system; large or small, based on microservices, containers, web services, monoliths, serverless, cloud or on-premise. It does not matter. In fact, the word system may be used in a larger context to mean a system that could include: embedded devices, IoT, batch, real-time, offline or temporary components.
At StackState, we have invested almost all of our time in getting this model right and have never gotten into a situation yet that could not be captured through this model. Let me walk you through the four simple ingredients.
1. Telemetry
"The process of recording and transmitting the readings of an instrument." Typically each live component and, indeed, also each live (network) connection in an IT system is continually emitting a wealth of information. For example, a microservice will log events, send or collect its own metrics, open and receive network connections and emit heartbeats. The operating system the microservice runs on will gather information on memory usage, PCU utilization, page usage, etc. (Learn more about telemetry.)
2. Topology
"the way in which constituent parts are interrelated or arranged." Topology is a word used in networking to describe a logical or physical network layout/graph. We use it in the broadest sense, meaning the description of the inter-dependencies between the IT components, be it hardware or software, that form a system.
The data model for topology is best suited to a directed graph. Storing a topology in a proper graph database is important if one hopes to achieve some type of performance when launching graph algorithms. Graph algorithms are extremely useful to find failure trees, indirect dependencies, weak spots, disconnections, etc. There are a ton of interesting facts one can find out about large IT systems when one has a complete picture of the actual physical up-to-date topology.
Fun fact, Hamilton also contributed to the wonderful field of graph theory and is among other things well known for what is called Hamiltonian graphs. Monitoring on the basis of telemetry alone, which is still mostly the norm nowadays, provides little insight into the big picture of what is happening because of the large volumes of unconnected data. The relationship between telemetry streams must either be known or discovered through some clever algorithms. We can simply skip over that part if we have a proper topology in place.
Now that we have set the stage, here is the interesting bit. What ties topology, telemetry and tracing together? Time.
3. Traces
Traces provide end-to-end insight into your entire IT landscape at the code level, with an easy to understand and navigate overview centered around the topology. Tracing is also fully integrated with our unique time travel capabilities, which capture all changes over time.
StackState tracing supports all major languages and has full support for distributed traces. StackState tracing even integrates cloud tracing technologies such as Amazon X-Ray and Azure Monitor.
4. Time
Like in quantum mechanics a waveform collapses to a particle when observed, telemetry collapses to the topology when observed. The topology is the state of the stack in the current time. One might visualize this as telemetry passing through the plane of topology. As soon as telemetry hits the topology plane it can be observed and change the topology.
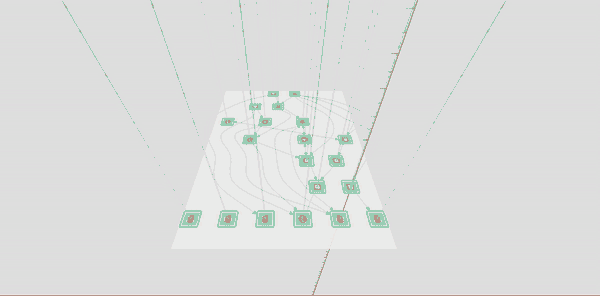
Not all streaming telemetry information is worth observing, but some parts are and those should be captured to update the state of the topology. Take, for example, a telemetry stream of the total amount of free memory of some server. Typically, when everything is running smoothly the stream can remain a waveform, but as soon as the amount is running dangerously low it is worth capturing this information on the topology. Like a particle that interacts with other particles, topological components that will be impacted by the fact that this server is running low on memory may proactively be notified by a traversal of the topology's dependency graph.
It is thus the act of observation in real-time that ties telemetry and topology together. In the StackState platform, we have a number of user-programmable stream processors that automatically handle the act of observation and result in changes in the topology. This system can react to any kind of metric streams, event streams and even changes to the topology that are generated based on these streams, thus producing a chain of effects. Real-time side effects can be pushed to other systems as well. For example, one might send events out to a chat app, an incident management tool or an orchestration tool.
At StackState we've built a special time-traveling graph database to accommodate this model. This gives us the ability to save each change in the topology as a snapshot of the entire graph in time. From a DevOps engineer's perspective, these snapshots are incredibly valuable information. One can replay, visualize and programmatically analyze all changes, which are worth observing by some self-defined standard, of the entire stack at any time. I urge you to imagine what you could do with that kind of superpower.
The 4T data model is extremely well-suited to describe what happens in a stack, but of course, is not well suited for each and every use case. Generally, it describes what is happening at what time and how each piece influences the next, but it does not necessarily describe why those pieces are there, why they connect with each other in the first place and how exactly they achieve their goals.
William Rowan Hamilton spent the remaining part of his life studying applications of quaternions. His son, William Edwin, wrote that his father "spoke of anticipated applications of quaternions to electricity, and to all questions in which the idea of polarity is involved applications which he never in his own lifetime expected to be able fully to develop, bows to be reserved for the hands of another Ulysses." Hamilton has been at the top of my mind because I identify with his poetic enthusiasm for something as abstract as a model. The applications of which are way beyond my understanding, but the benefits of which inspire me to work on StackState every day and enable our customers to run their business in an unprecedented way.
Want to learn more about the 4T data model and see it live in action? Request a demo of the StackState platform to get a better understanding of our observability solution.


