
StackState is an out-of-the-box solution to observe your entire Kubernetes stack, identify problems, automatically highlight the changes that cause them and provide the full context you need for efficient and effective troubleshooting. Our clear and affordable pricing makes it easy to get started today .
StackState’s unique approach to Kubernetes observability
Most of today’s observability solutions focus on the state of isolated services. StackState is different in many ways:
Kubernetes best practices out of the box. StackState comes with a set of out-of-the-box monitors that monitor your environment and alert you if any issue is arising, so you can proactively address it before it becomes a problem. Our out-of-the-box monitors implement industry best practices but also go further: we monitor not only metrics signals, but also your environment’s topology to look for issues like misconfigurations and compliance violations. This proactive monitoring helps you detect any issue before it becomes a problem. We also give you actionable alerts by automatically adding remediation hints.
Track all changes in your services running on your Kubernetes cluster. Capturing changes in the environment is done automatically: each Kubernetes event, as well as each change in configuration, is captured and mapped to your environment’s real-time topology. In about 80% of failures, a change is the cause, and this automatic dependency mapping makes it easy to find the change causing the issue.
Detect issues before they cause a service disruption. Our Autonomous Anomaly Detector highlights any change in behavior of the application or infrastructure by monitoring the most important metrics. The anomaly detection feature knows how everything is connected and focuses on the most important signals, so you can prevent issues from growing from a small anomaly into an outage that affects end users and business outcomes.
Automate troubleshooting. StackState automatically clusters all alerts to reduce noise and focus attention on the most urgent issues. Our automated root cause analysis feature shows all alerts clustered together to directly show the failing component that cause other components to fail, so you can focus on the actual cause of an issue instead of chasing ghosts. Our automated root cause analysis also correlates all changes in configuration and runtime behavior to these alerts to show what causes the failures.
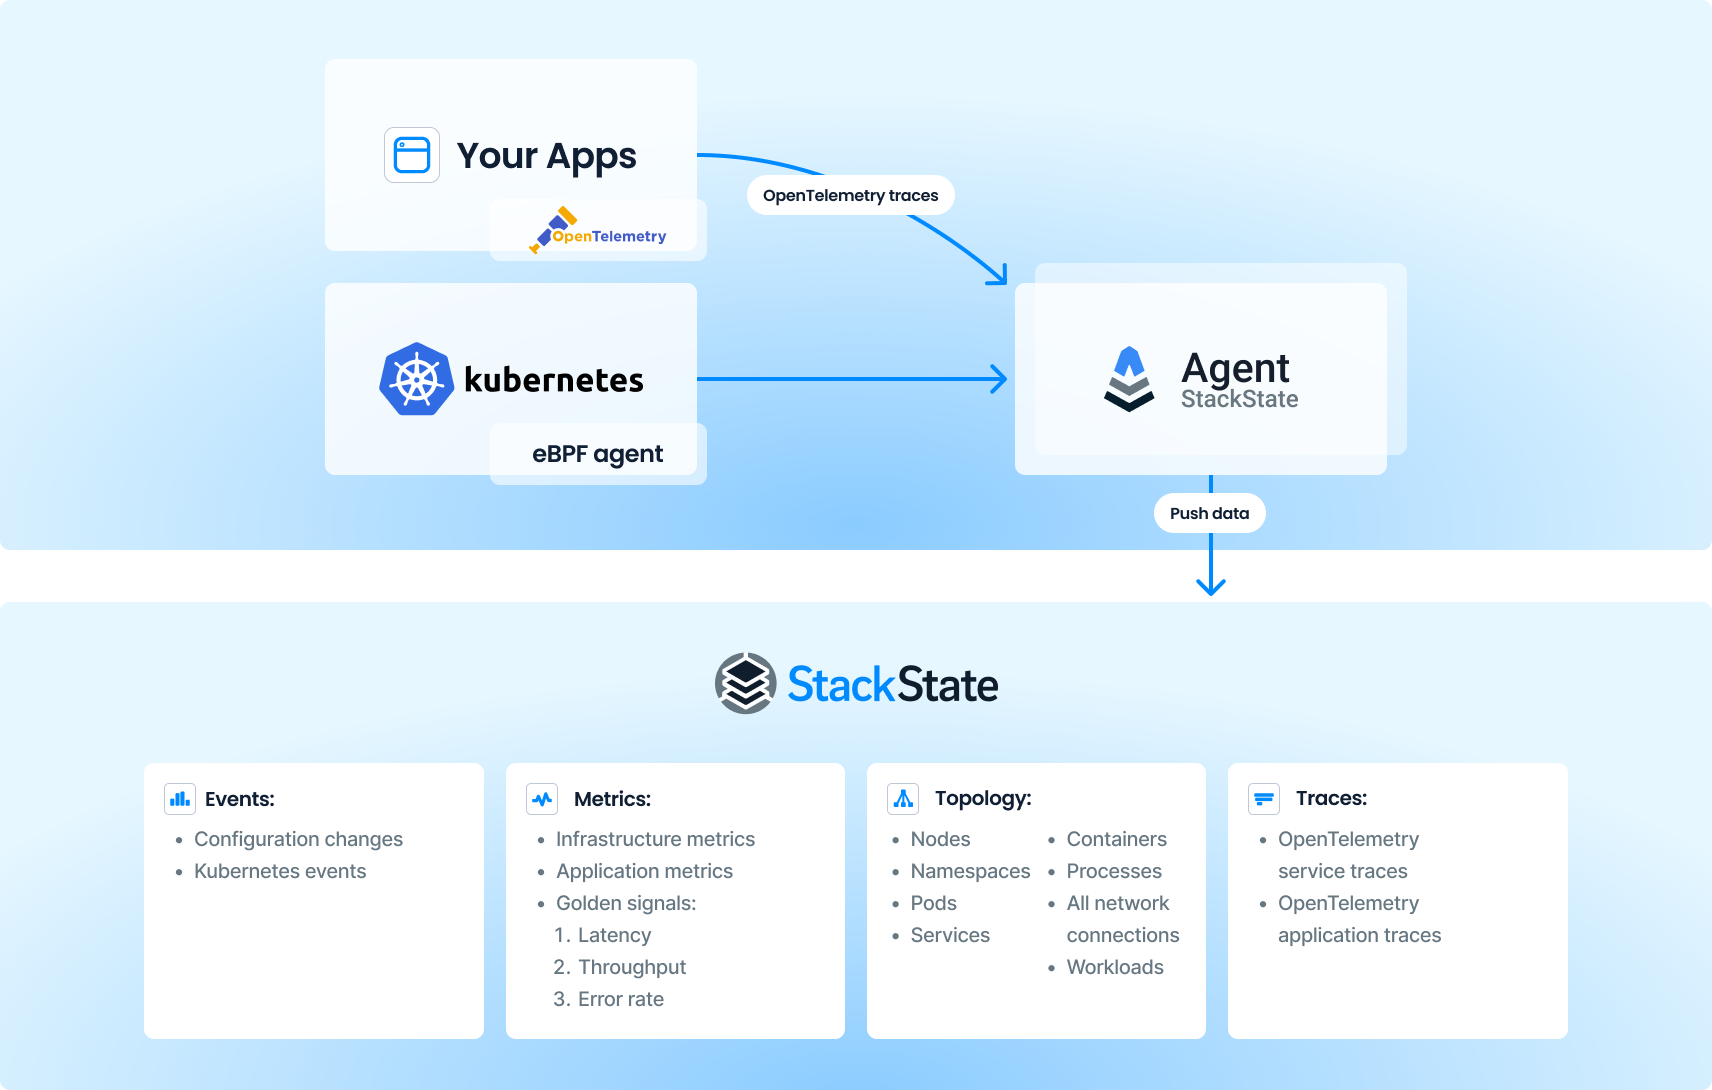
Get360 degrees of context across your stack. StackState automatically captures your full topology, from external (cloud-based) load balancers through all services, all the way to the process running on a container in a pod. With this information, troubleshooting complex issues becomes an easy and automated task.
Our topology is fine-grained and updated in real time. We also provide the ability to go back in time to see what your stack looked like when an issue started to happen. You can see what containers and pods were in existence, how they were configured and how everything was connected during that period, with all metrics and traces for the corresponding services automatically related at any given time.
Business outcomes with StackState and Kubernetes
StackState is an economical and agile way to get deep insights into your Kubernetes environment and ultimately deliver more reliable experiences for your customers.
Meet your service level objectives. StackState observes your environment 24x7, 365 days a year so your engineers can focus on improving your services instead of chasing issues. When an issue does occur, MTTR can be reduced by 80% or more.
Reduce observability costs. Either remove the overhead of maintaining a complex open source-based observability stack or reduce the need for expensive APM tools.
Reduce toil to let SREs focus on the most important issues at hand, rather than on manual and unguided troubleshooting.
Groundbreaking technology
No other company has our unique combination of powerful and silo-spanning technology:
Time-series graph database to track all changes. StackState is built on a proprietary versioned graph database that tracks each change in topology up to the millisecond, making it really easy to look back over time to see what was happening when an issue began. This database is distributed, scalable and comes with an easy query language to traverse the full graph.
API integrations. StackState uses an agentless approach to collect high-level information, augmented with agents to get deep visibility into the run-time behavior of your clusters.
eBPF-based, low-overhead agent. Our eBPF-based, low-overhead agent tracks all processes, containers and their communications inside Kubernetes clusters. Our agent not only detects the traffic, it also analyzes it to extract metrics for throughput, error rate and latency. This technology works with applications written in any programming language. With this capability, StackState is able to automatically detect any anomaly in traffic patterns and alert teams proactively, so action can be taken before something really fails. The agent is deployed via a Helm Chart as a daemonset and runs only once on each host, with an overhead of only 1%. This overhead is extremely low compared to other observability tools, which sometimes take 5-10%.
OpenTelemetry-compatible. StackState automatically converts OpenTelemetry traces into a meaningful topology that relates all services to each other and their underlaying infrastructure. The platform automatically extracts the golden signals of throughput, latency and error-rate and plots them on each corresponding relation or service. You get effective troubleshooting with all necessary context only a mouse-click away.
Affordable pricing for comprehensive Kubernetes observability
StackState can be as cheap as $15 per host per month (physical or virtual), containers included. This straight-forward and affordable pricing model allows you to use our advanced observability everywhere, not just for your top five most important applications.
A few key Kubernetes integrations
StackState is compatible with all major Kubernetes distributions:
“Vanilla” Kubernetes
Amazon Elastic Kubernetes Service – EKS
Azure Kubernetes Service – AKS
Google Kubernetes Engine – GKE
OpenShift
StackState also integrates deeply with major cloud providers, log aggregators and other monitoring tools to give a single plane of glass for advanced troubleshooting using AIOps.
Get started with StackState and Kubernetes today
StackState can run as an on-premise full stack observability solution or as SaaS. With our SOC2 compliant SaaS service, you can set up monitoring for your full environment in 10 minutes:
Get your credentials by submitting this form.
Log in.
Install the Kubernetes StackPack and agent via a simple Helm deployment.
Use the predefined views to see all your namespaces and the services running on them, including any hidden issues. Use our fully automated root cause analysis for essential troubleshooting assistance.


