Observability Maturity Model Fundamentals series, Part 4
This series of six blogs outlines the basics of the Observability Maturity Model. Use it to identify where you are on the observability path, understand the road ahead and provide guidance to help you find your way.
Go back to or skip to: Part 1 / Part 2 / Part 3 / Part 5 / Part 6
Level 3 Overview
What is the cause of the incident and what is the impact?
It’s not surprising that most failures are caused by a change somewhere in a system, such as a new code deployment, configuration change, auto-scaling activity or auto-healing event. As you investigate the root cause of an incident, the best place to start is to find what changed.
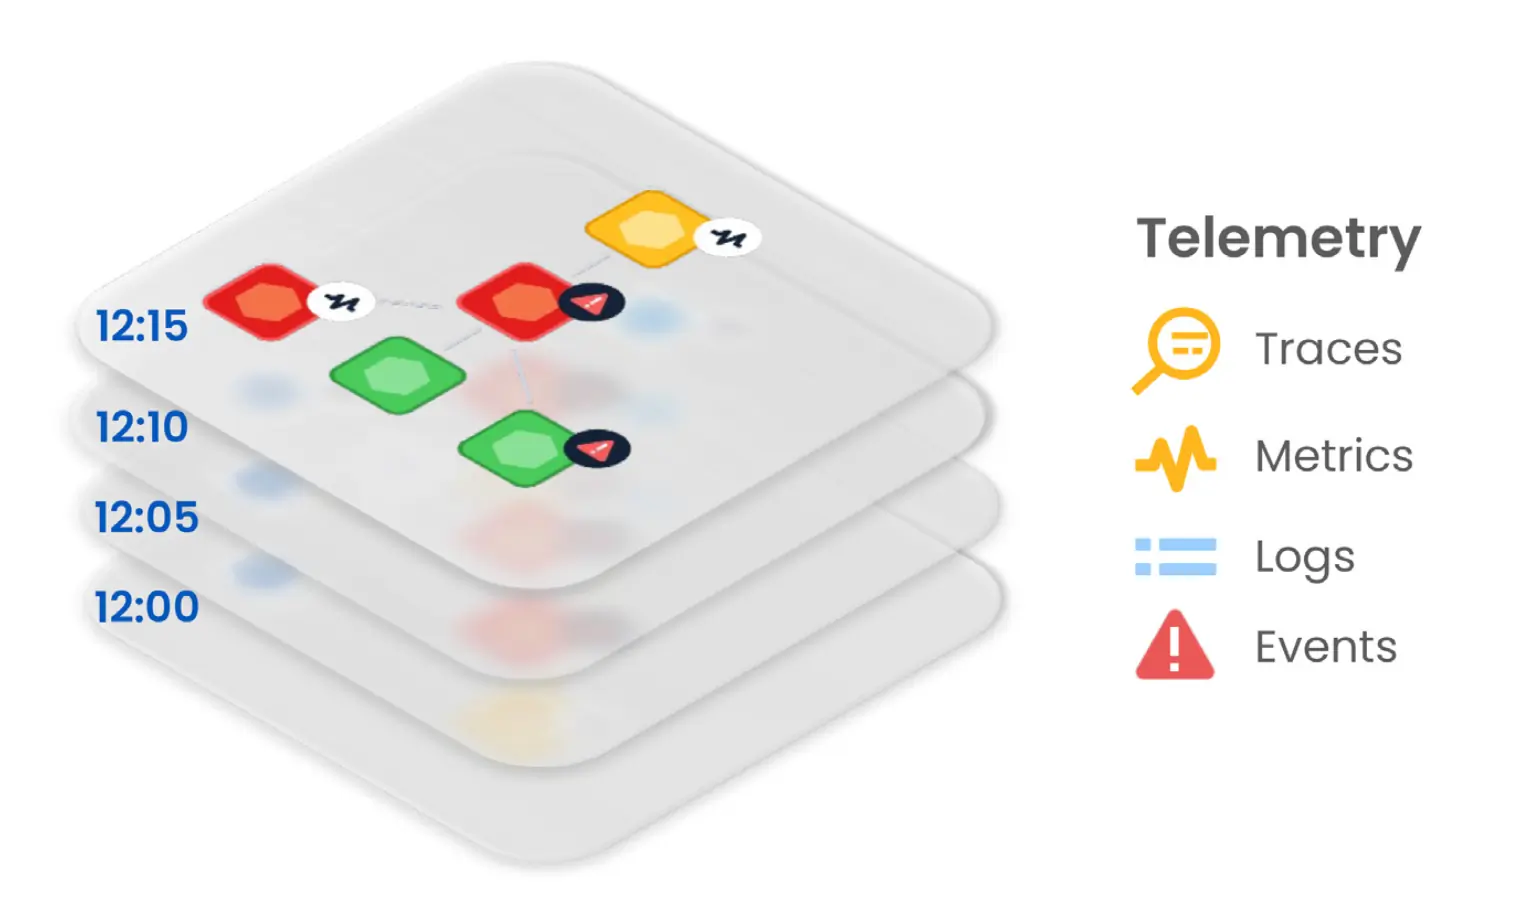
To understand what change caused a problem and what effects propagated across your stack, you need to be able to see how the relationships between stack components have changed over time:
What did the stack look like when a problem began?
What components are affected?
How are all the alerts related?
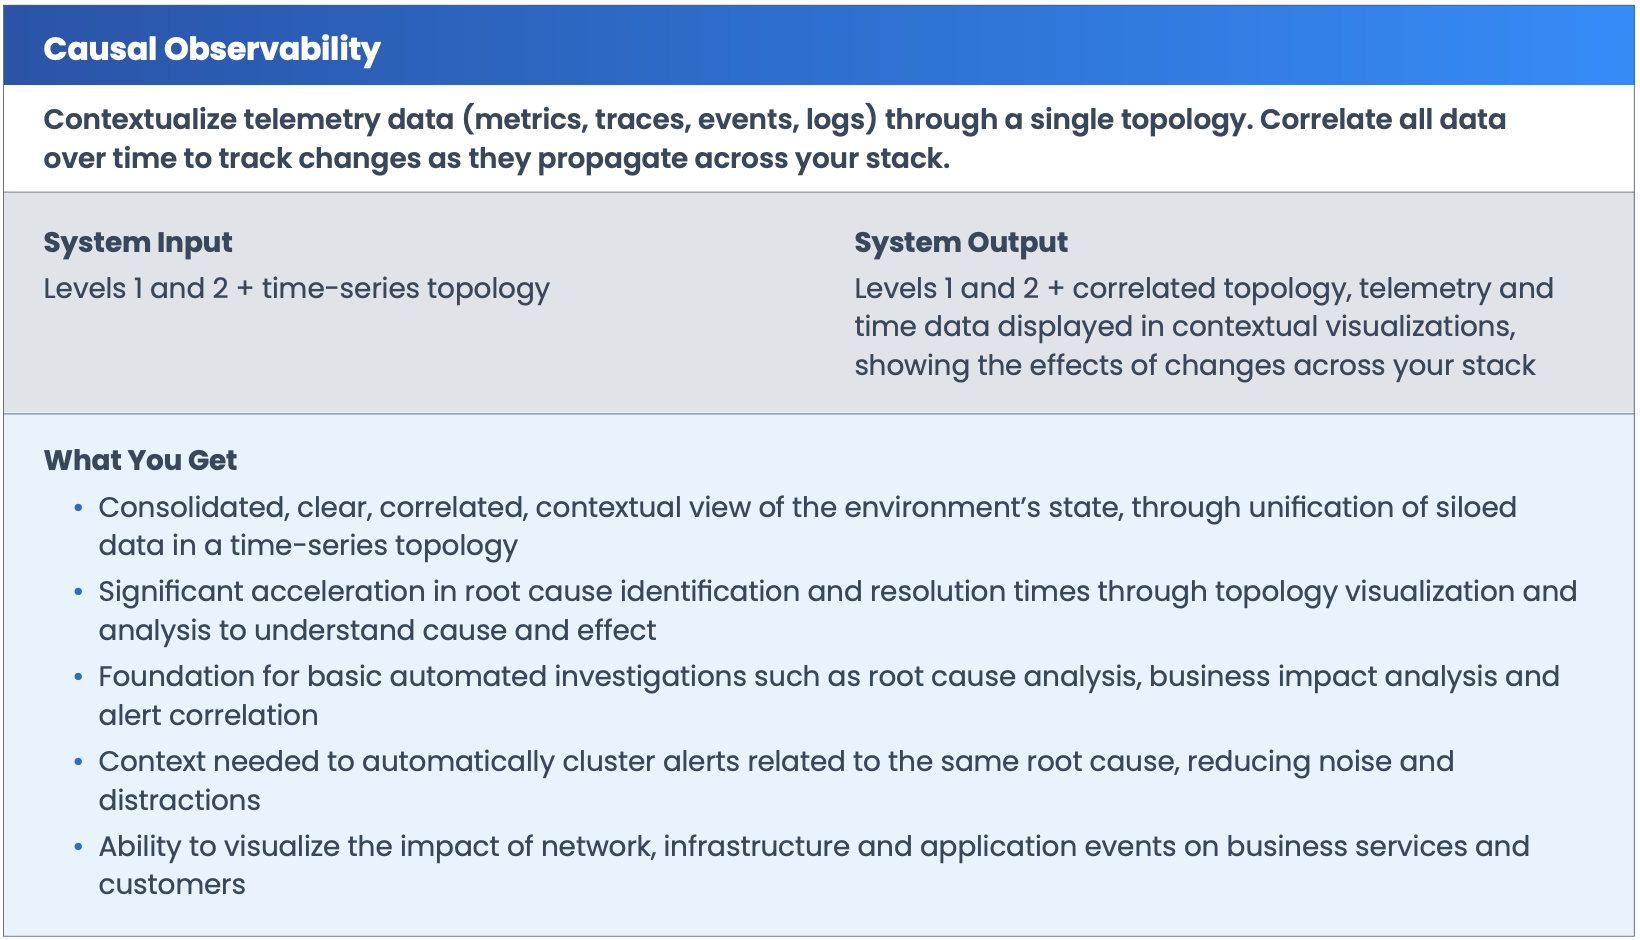
We call this level of insight, which lets you track cause and effect across your stack, causal observability — it builds on the foundation laid in Levels 1 and 2.
Deriving patterns from data within a topology will establish relevancy and illustrate hidden dependencies. Using topology as part of causality determination can greatly increase its accuracy and effectiveness.
– Gartner® Market Guide for AIOps Platforms, May 2022, Pankaj Prasad, Padraig Byrne, Gregg Siegfried
Topology is the first necessary dimension for causal observability
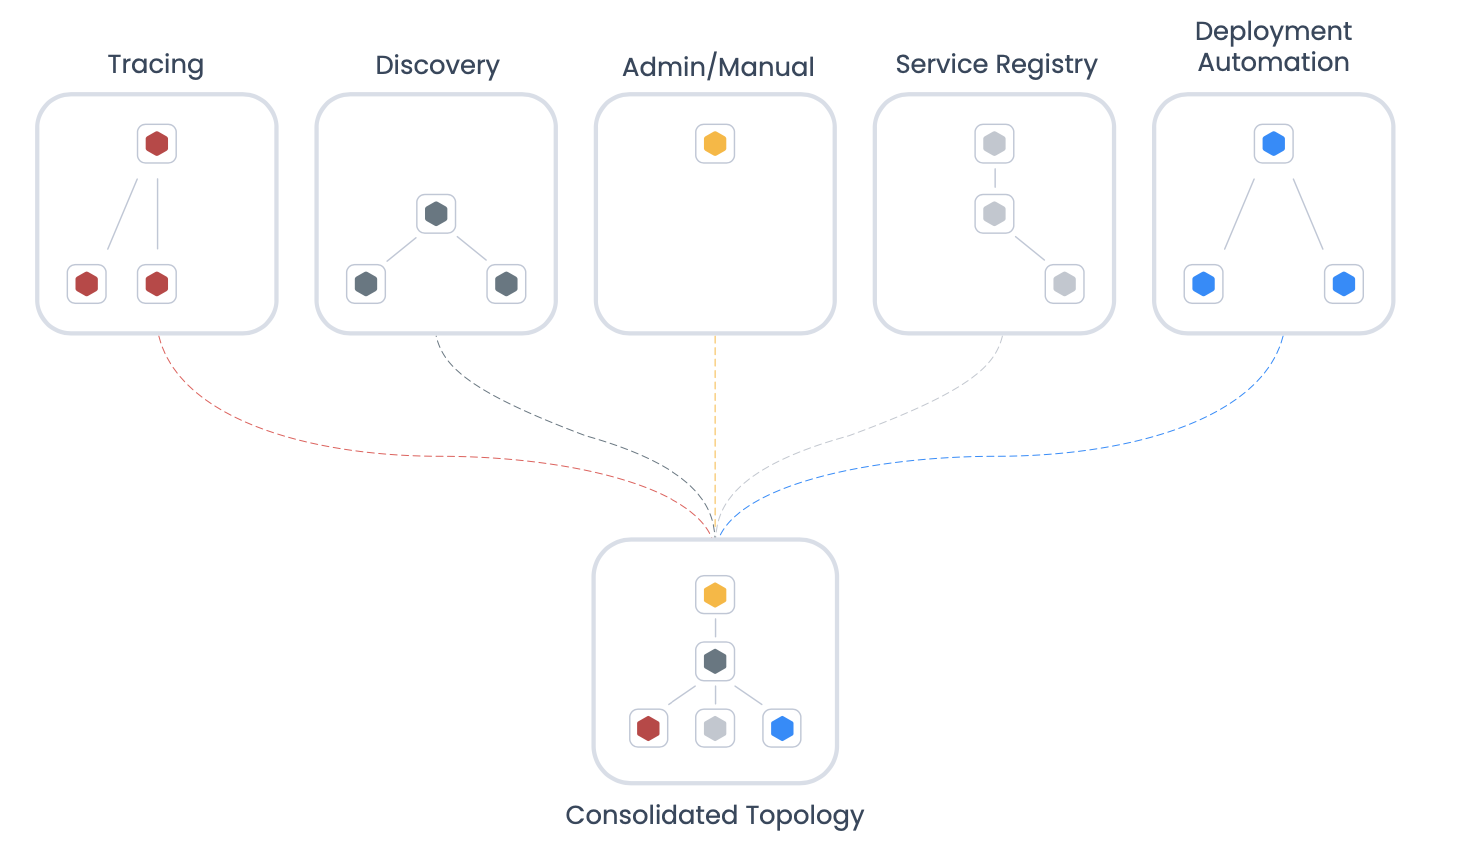
Topology is a map of all the components in your IT environment that spans all layers, from network to application to storage, showing how everything is related. Topology incorporates logical dependencies, physical proximity and other relationships between components to provide human-readable visualization and operationalized relationship data.
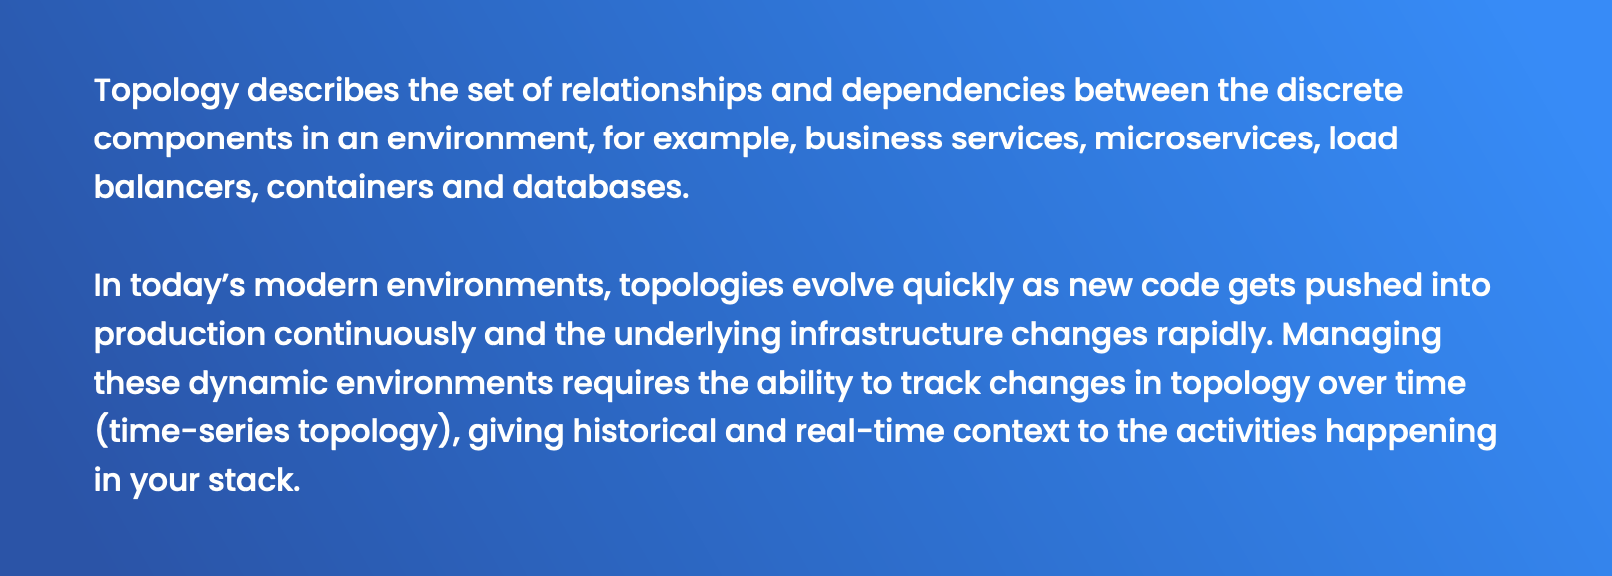
Modern environments consist of so many dynamic layers, microservices, serverless applications and network technology that adding an up-to-date topology to your observability mix is essential to separate cause from effect. Topology provides anchor points for thousands of unconnected data streams to give them structure, making previously invisible connections visible. Topology visualization lets you view telemetry from network, infrastructure, application and other areas in the context of full-stack activity; it also gives you crucial context to know how your business is affected when something breaks.
However, for most companies, adding topology is not enough to provide causal observability on its own. Especially in today’s dynamic modern environments with microservices, frequent deployments, ever-changing cloud resources and containers spinning up and down, topology changes fast. What your stack looks like now is probably not what it looked like when a problem first began. So a second dimension is necessary to create the foundation for causal observability: time.
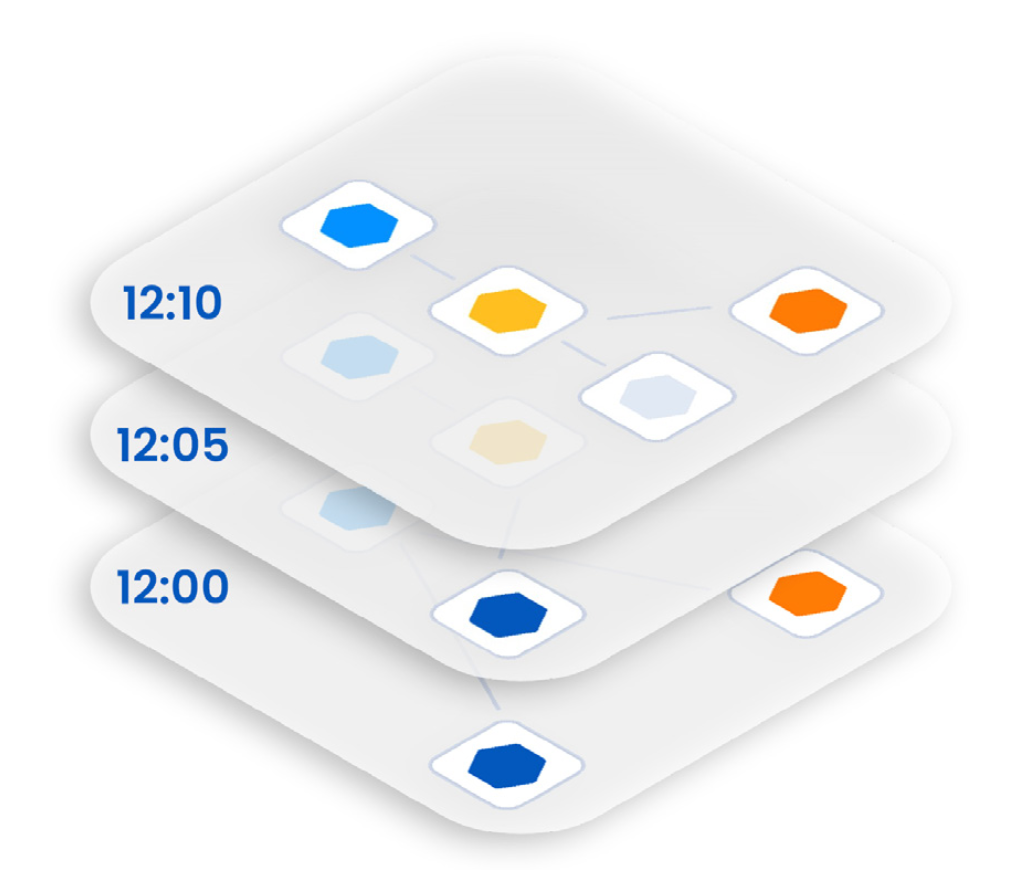
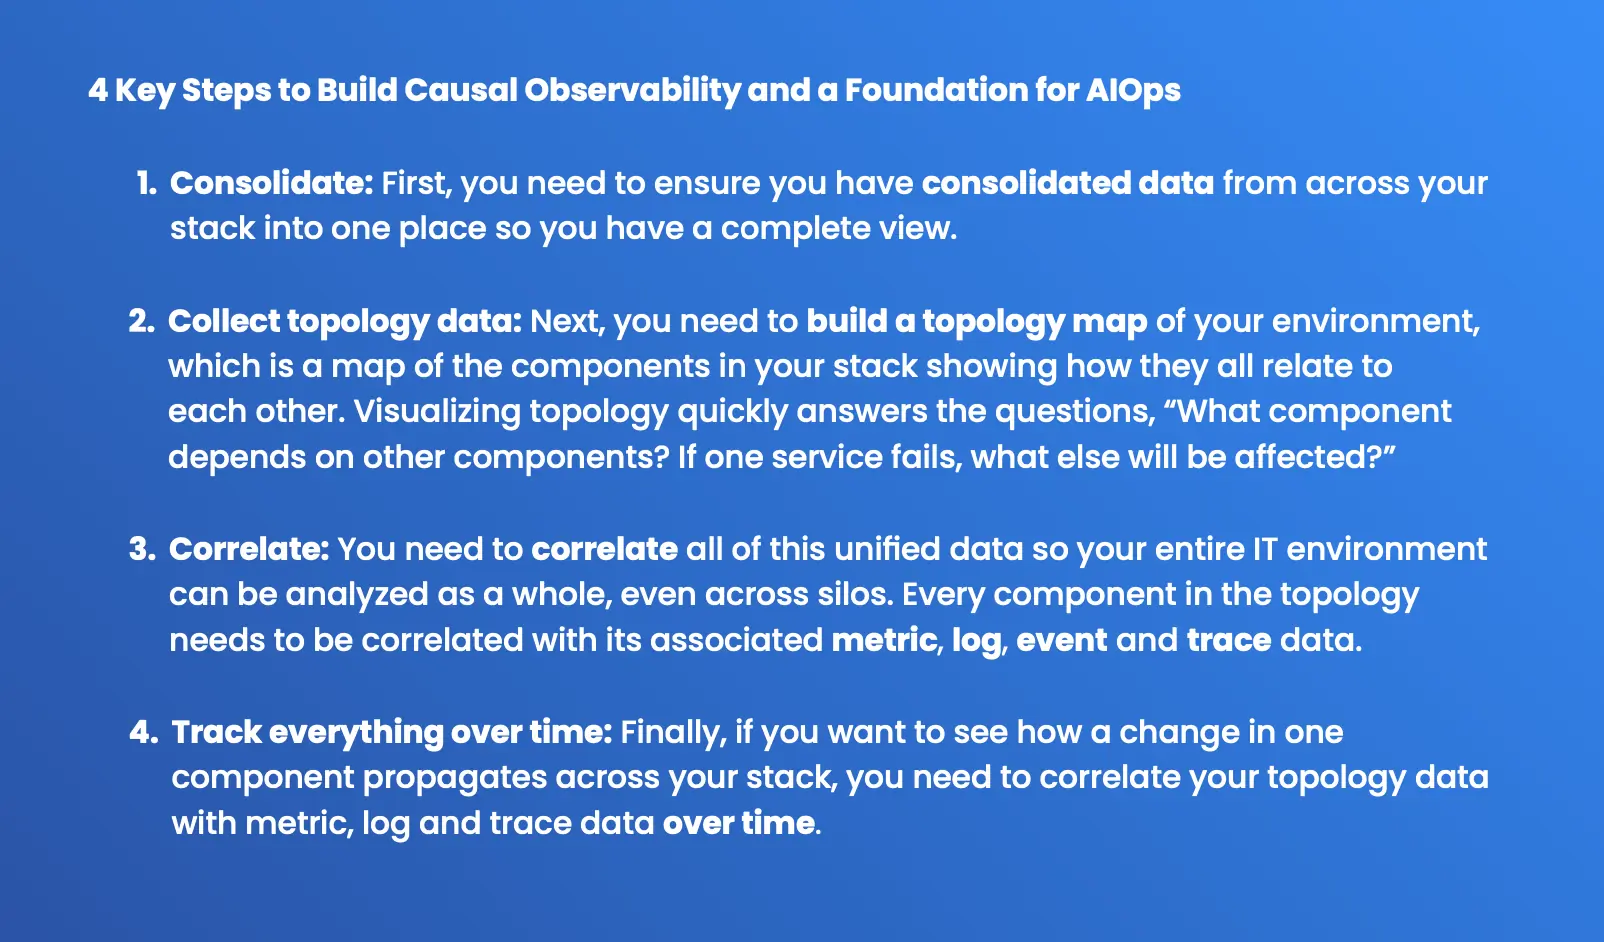
And finally, to understand the dynamic behaviors of modern IT environments and get the context required to achieve causal observability, you need to correlate your environment’s topology with its associated metric, log, event and trace data over time.
At Level 3, the additional dimensions of topology and time, correlated with telemetry data, show you the cause and impact of any change or failure across the different layers, data silos, teams and technologies — significantly improving resolution times and business outcomes. You also have the foundation to begin automating root cause analysis, business impact analysis and alert correlation. This deeper level of data is also required for more advanced AIOps, as you’ll read in Level 4.
Next Step: Proactive Observability With AIOps
As noted above, Gartner points out that topology can greatly increase the accuracy and effectiveness of causal determination. Level 3 is a big step forward, but unifying data from different silos poses challenges in terms of data normalization, correlation and quality that may require new capabilities or even organizational changes to resolve. In addition, it is difficult to collect and operationalize high-quality topology data at scale, especially in less modern environments.
Each topology source needs to continuously flow through into the master topology, so you need to ensure you have a system with the capability to store topology over time. Storing topology that is correlated with telemetry data over time presents an even bigger challenge.
With data volumes reaching or exceeding gigabytes per minute across a dozen or more different domains, it is no longer possible, much less practical, for a human to analyze the data manually in service of operational expectations.
– Gartner® Market Guide for AIOps Platforms, May 2022, Pankaj Prasad, Padraig Byrne, Gregg Siegfried
Consider these issues as you develop your implementation plan. Also keep in mind that the velocity, volume and variety of data at Level 3 is usually so large that to achieve your overall reliability goals, AI is likely necessary to help separate the signal from the noise. When you take the step to Level 4, you add artificial intelligence for IT operations (AIOps) on top of Levels 1-3 to gain more accurate insights.


