This week we released v5.0 of StackState’s observability and AIOps platform, which introduces a rich set of new capabilities. Our latest release contains a little something for everyone responsible for reliably running business critical workloads in dynamic environments – SREs, DevOps, central platform teams, even business teams – and for new and existing users alike. It’s one step further in our mission to empower organizations to deliver extraordinary customer experiences through autonomous, incident-free IT operations.
StackState’s v5.0 give your team deeper observability insights with less effort, helping you troubleshoot faster and maintain reliable operations. They make it even easier to use StackState to:
Unify, correlate and visualize all of the complex activity in your stack
Quickly find the root cause of incidents
Reduce alert noise and focus your resolution efforts
Determine business impact and set priorities
Proactively prevent problems with early warnings and AI anomaly detection
We’ll give you some release highlights in this blog post; keep an eye out over the coming weeks for additional blogs with details on key features.
New 4T Monitors
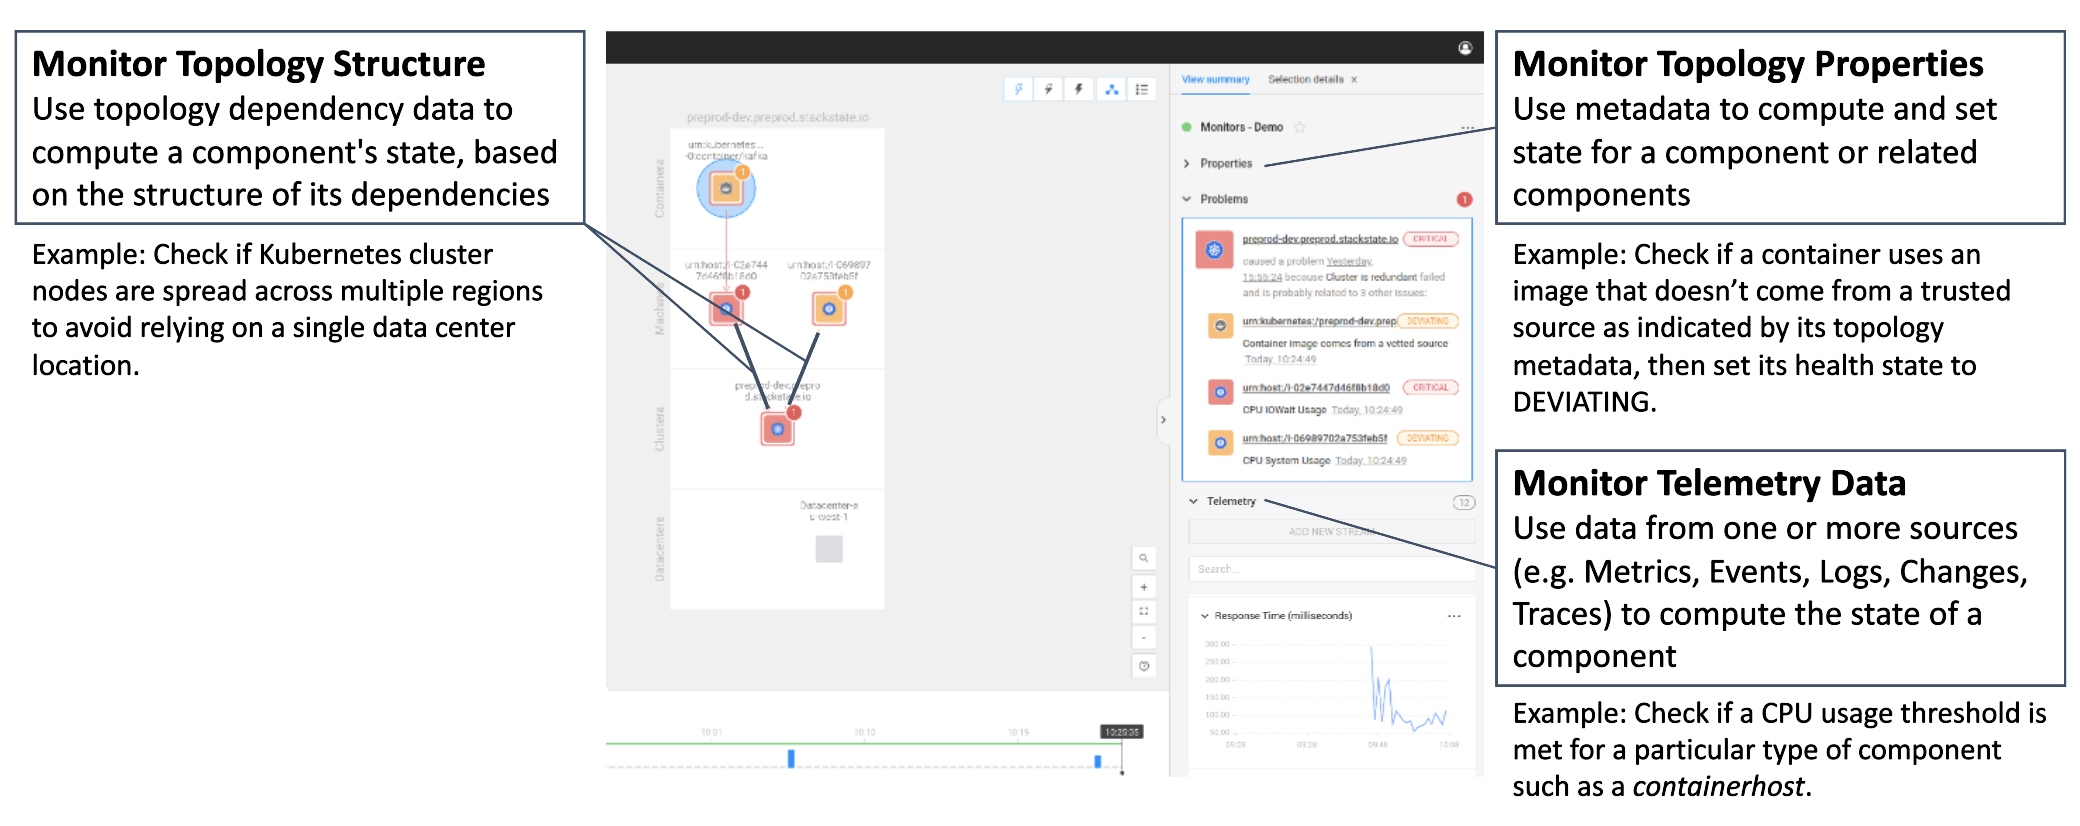
StackState is the only topology-powered observability and AIOps platform that visualizes system-wide telemetry data correlated with topology at every point in time. In v5.0, we are introducing 4T® Monitors, which bring a new dimension to software monitoring – now you have the ability to monitor topology in addition to telemetry data. With our new 4T Monitors, StackState becomes the first platform that can observe topology, providing much more extensive and complex rule validation than other tools. You can trigger alerts based on changes in topology structure, topology metadata, metrics, events and any combination. 4T Monitors use the full suite of 4T data to give the most insightful and accurate indications available, delivering a direct impact for the business:
Better insights drive higher reliability – With the addition of topology as a parameter that can be monitored, we give you much wider monitoring capability and thus much deeper insights. Always know what’s going on in your stack and be warned before a failure becomes an outage.
Guard rails and a safety net for all teams – 4T Monitors give central SRE and platform teams the ability to build extensive control mechanisms that ensure reliable, secure, compliant operations. Teams across the organization can operate freely within these guardrails, knowing they have a safety net: deviations from best practices will be quickly detected and can be easily addressed before problems occur.
Basic SLO monitoring – Topology- and metrics-based monitors can be created to track Service Level Objectives (SLOs), so the business can stay continuously updated on how well they are meeting their commitments.
4T® Monitors let you keep track of topology structure and metadata, which other observability and monitoring tools lack the foundation to do. For example, you can check if a publicly accessible, business-critical service is configured in a highly available fashion (at least three Kubernetes pods available at all times) and with redundancy (all three pods are replicated in multiple data centers). Or you can set a monitor to trigger an event when a container uses an image that doesn’t come from a trusted source, as indicated by its topology metadata, and automatically set its health state to DEVIATING.
Note: Monitors are the next generation of StackState’s current Check feature and will replace checks in a later release.
Improved Topology Visualizer and Right Panel
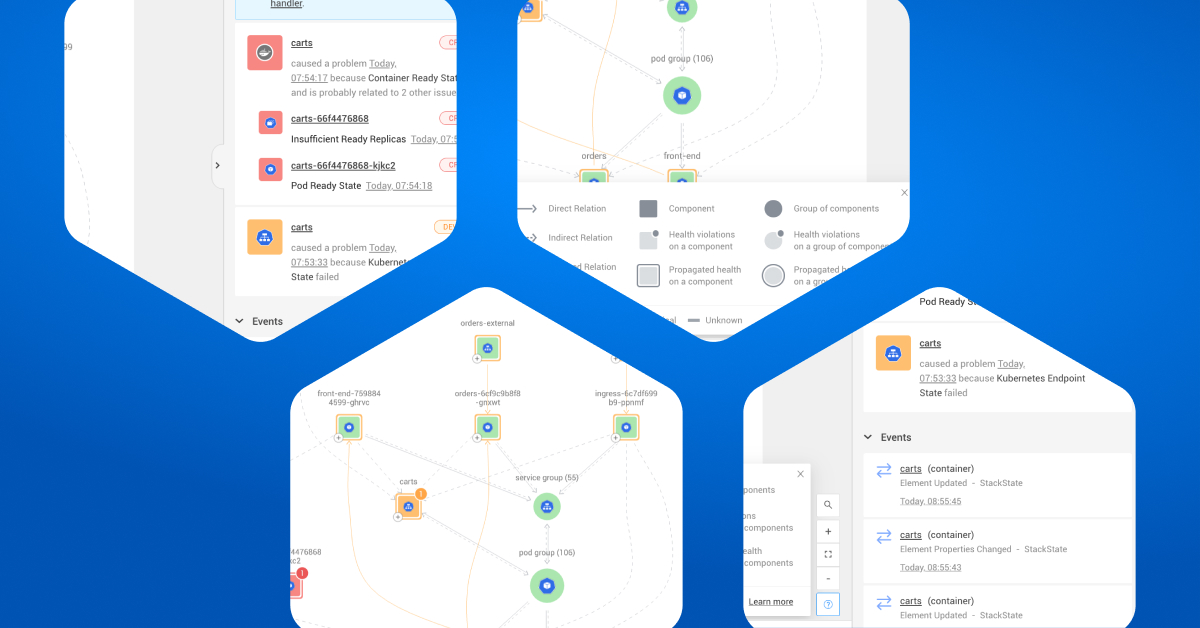
In v5.0, we are introducing a fresh, more intuitive design for our topology visualizer. StackState already has the most comprehensive topology views available to help you see which components in your stack are related and understand how changes affect your stack. Now we’ve made them easier to use for streamlined troubleshooting.
As a core feature of our product for years, StackState provides the ability to propagate health state through your topology, showing visual indication on components if any downstream components have DEVIATING or CRITICAL health states. This feature helps teams easily see how a problem in one area may propagate to other services that depend on it, helping them to track the effects of change across the stack and spot problems fast.
The new topology visualizer changes how StackState represents propagated health states, creating a cleaner display. Its UI has been enhanced to simplify use and focus user attention on the most important elements. The Right Panel in the visualizer also brings new features, adding a second tab for Selection Details and a Back button so you can easily traverse your troubleshooting path. These improvements help teams find the root cause of problems faster and they lower the learning curve for new users, helping everyone to be more productive with StackState.
New StackState CLI
In v5.0 we are introducing a new CLI that provides a state-of-the-art UX and powerful new commands, giving you an ultra-fast and more convenient way to interact with StackState than the previous CLI. You can now set configurations, run queries, install StackPacks and create and apply complex 4T Monitors, all by executing commands and scripts directly from your system’s command line on multiple operating systems. The new CLI also features machine output, so it’s easy to integrate with modern GitOps pipelines.
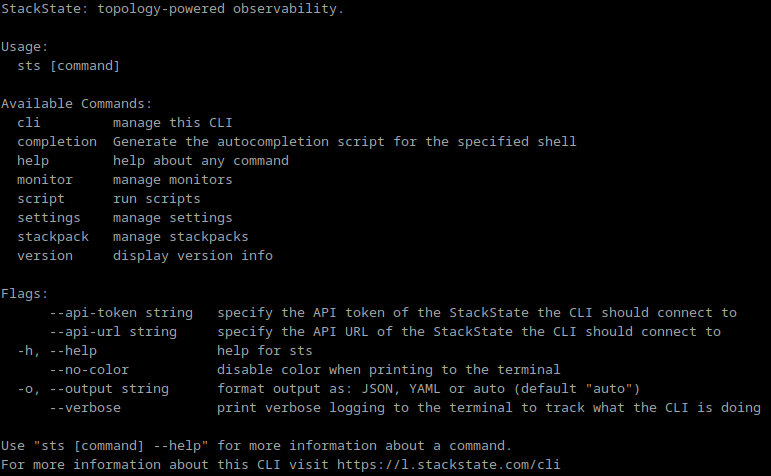
Note: The new CLI will replace the existing CLI in the next few releases.
Expanded Support for OpenTelemetry Traces
A few months ago, in StackState v4.6, we released support for OpenTelemetry traces - specifically for serverless AWS Lambda applications built with Node.js. With v5.0, we add the ability to automatically capture trace information from applications written in any language, using OpenTelemetry custom spans. Operationalizing this low-latency trace data requires no integration and immediately enriches your topology with additional relationships and telemetry.
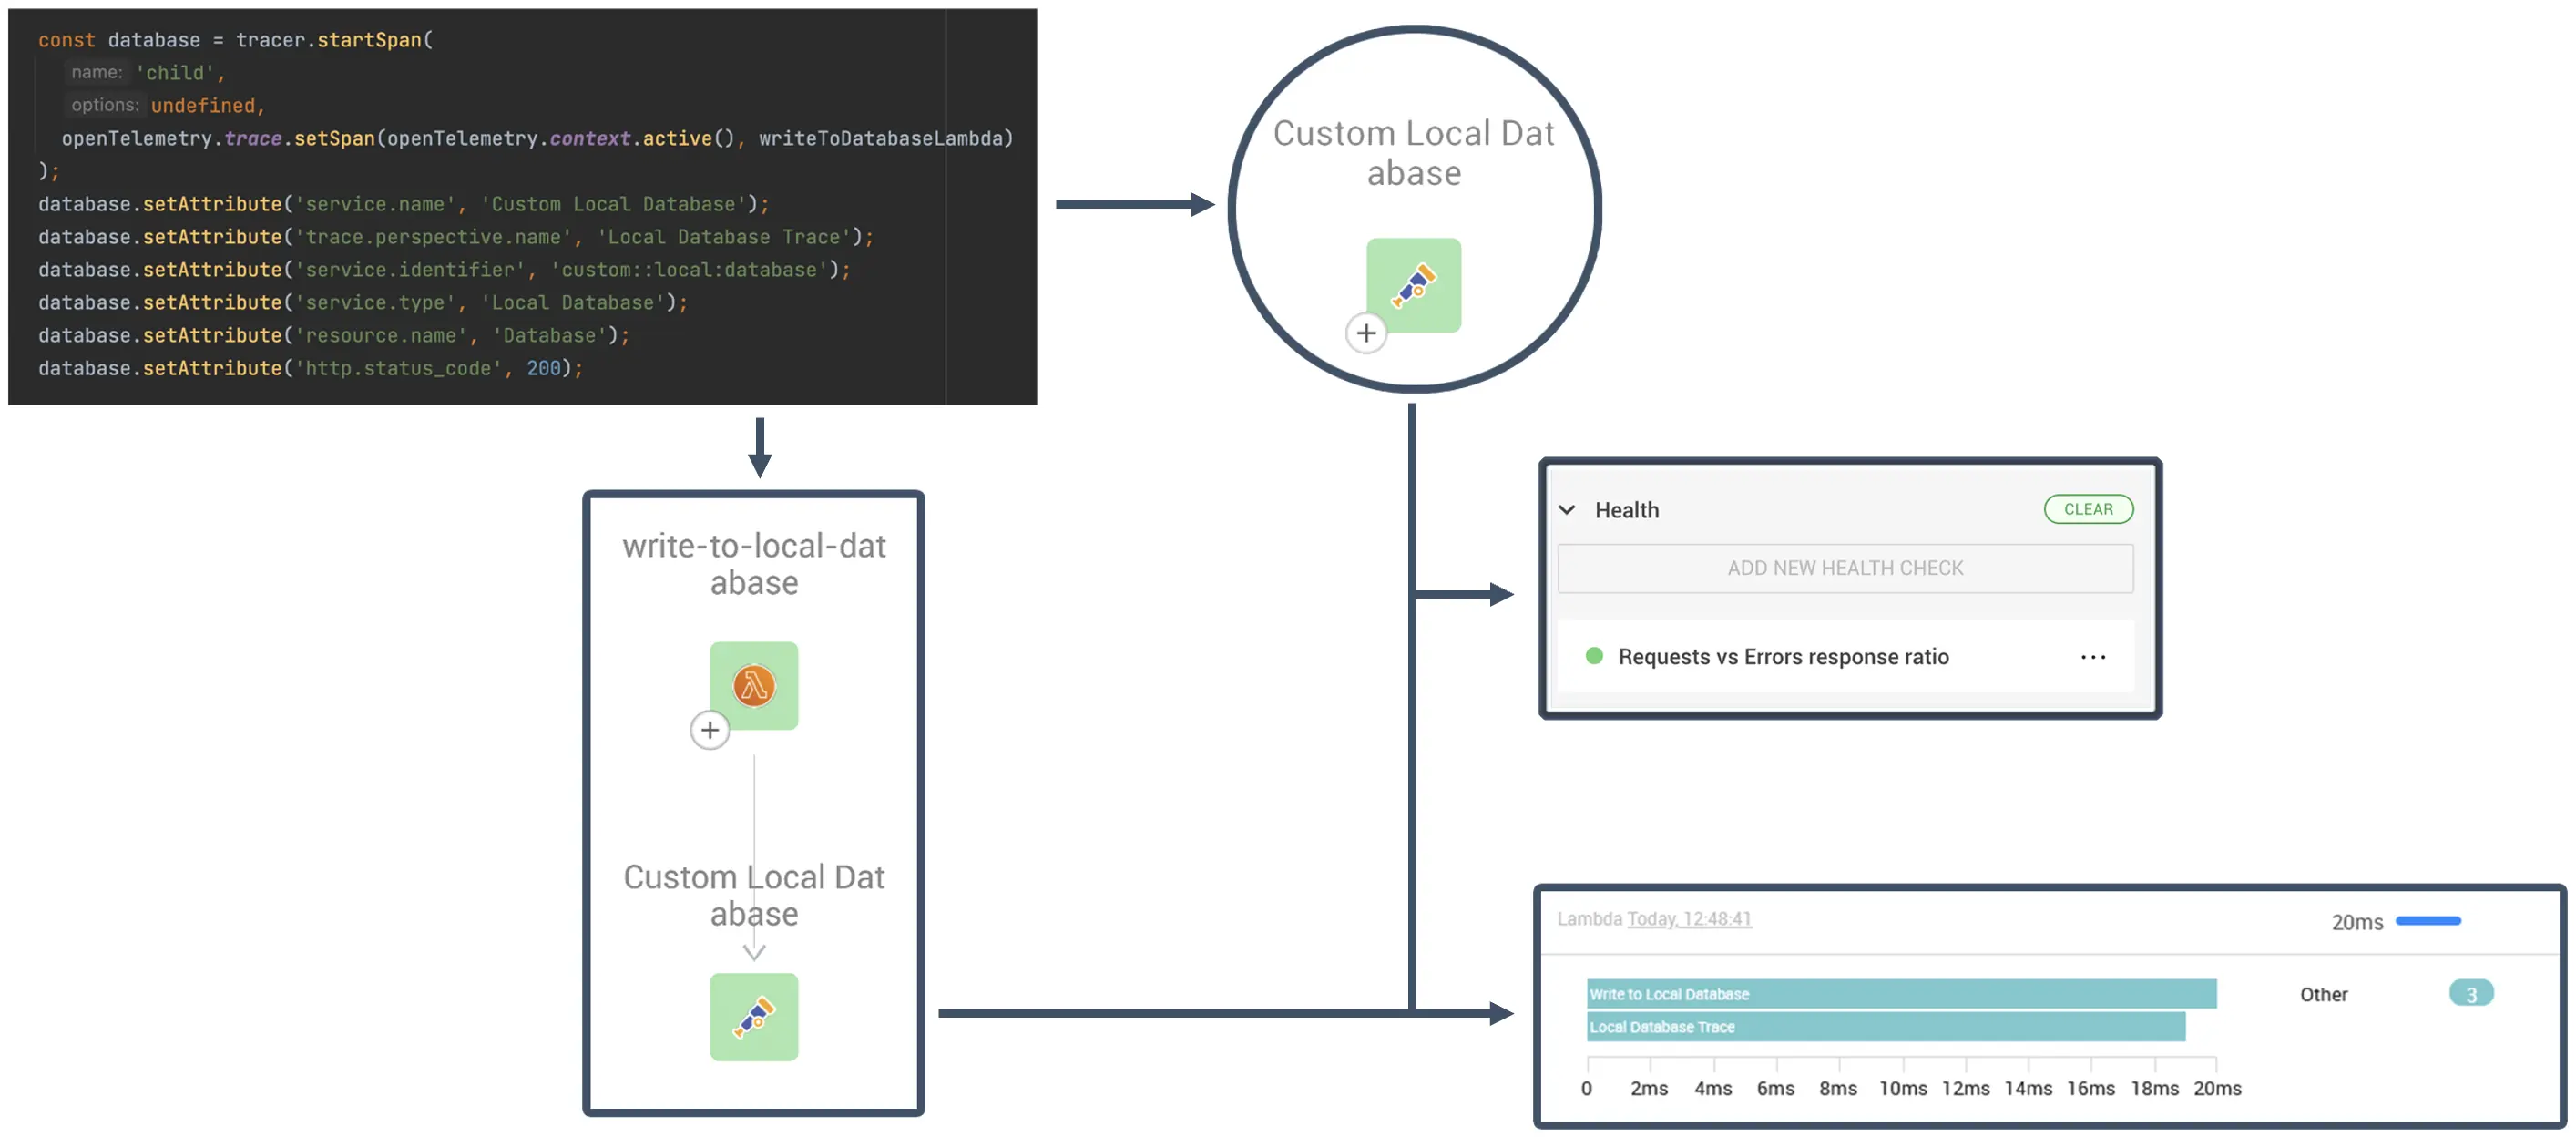
To learn more about how OpenTelemetry traces can instantly add breadth and depth to StackState’s visibility, watch a comprehensive demo video from one of our developers and read his blog, “How to Use OpenTelemetry to Troubleshoot a Serverless Environment with StackState.”
Accuracy Feedback for Anomalies
StackState already offers the ability to use AI-based insights to improve observability for your end-to-end environment. Our Autonomous Anomaly Detector correlates AI-discovered anomalies with StackState’s comprehensive topology data, applying our 4T® Data Model to link suspicious behavior with probable root cause in your overall environment. By using AI and machine learning to both detect anomalies and to determine which ones matter, you can focus your efforts on important events and move quickly to proactively predict issues.
With v5.0, users now have the ability to provide feedback about the accuracy and usefulness of the anomalies flagged by StackState: 👍🏻 or 👎🏻 plus a comment. The feedback can be sent to the StackState AI team, who will use it to optimize anomaly detection algorithms and continue to improve accuracy.
And those are just the highlights! StackState v5.0 sets a new standard for observability, helping your team detect and locate problems faster than ever, with even less manual effort. The v5.0 release contains lots of other improvements too – for a full list, check out the release notes .
Want to see how all of these new features translate into faster troubleshooting, better control, and less effort for your team? Please watch the on-demand webinar: "Getting Started With Observability."


